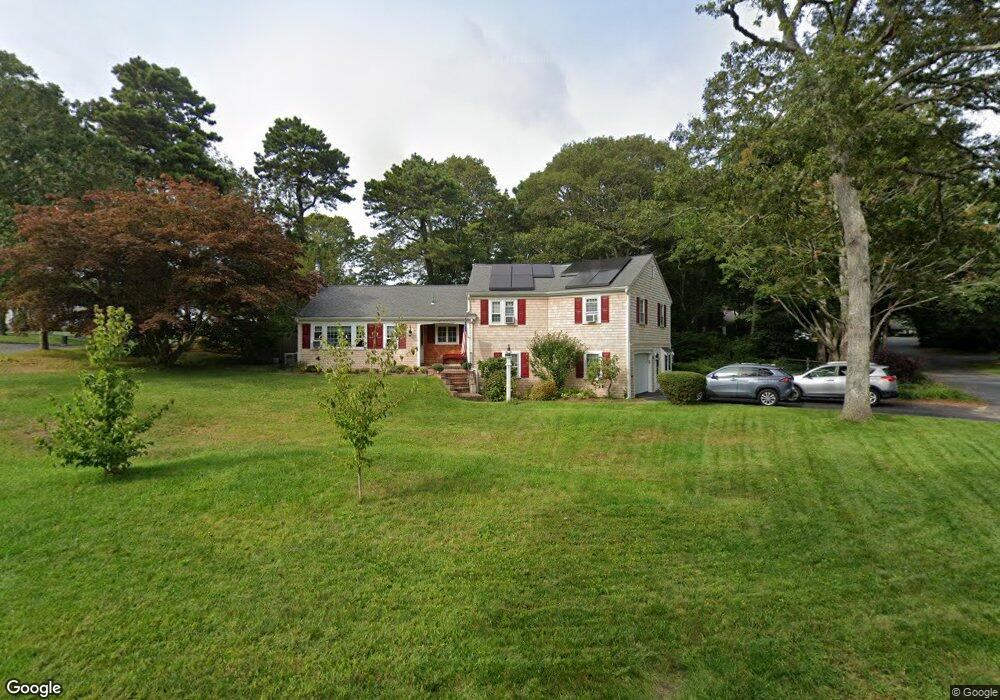
20 Pebble Beach Way South Yarmouth, MA 02664
Estimated Value: $637,429 - $706,000
3
Beds
3
Baths
1,322
Sq Ft
$509/Sq Ft
Est. Value
About This Home
This home is located at 20 Pebble Beach Way, South Yarmouth, MA 02664 and is currently estimated at $672,607, approximately $508 per square foot. 20 Pebble Beach Way is a home located in Barnstable County with nearby schools including Dennis-Yarmouth Regional High School and St. Pius X. School.
Ownership History
Date
Name
Owned For
Owner Type
Purchase Details
Closed on
Jun 19, 2018
Sold by
Donovan Ft
Bought by
Donoban Nest Egg Ft
Current Estimated Value
Purchase Details
Closed on
Jan 28, 2013
Sold by
Donovan William J and Donovan Claire W
Bought by
Donovan Ft
Create a Home Valuation Report for This Property
The Home Valuation Report is an in-depth analysis detailing your home's value as well as a comparison with similar homes in the area
Home Values in the Area
Average Home Value in this Area
Purchase History
| Date | Buyer | Sale Price | Title Company |
|---|---|---|---|
| Donoban Nest Egg Ft | -- | -- | |
| Donovan Ft | -- | -- |
Source: Public Records
Tax History Compared to Growth
Tax History
| Year | Tax Paid | Tax Assessment Tax Assessment Total Assessment is a certain percentage of the fair market value that is determined by local assessors to be the total taxable value of land and additions on the property. | Land | Improvement |
|---|---|---|---|---|
| 2025 | $3,856 | $544,600 | $238,000 | $306,600 |
| 2024 | $3,601 | $488,000 | $207,000 | $281,000 |
| 2023 | $3,442 | $424,400 | $174,700 | $249,700 |
| 2022 | $3,409 | $371,400 | $156,300 | $215,100 |
| 2021 | $3,353 | $350,700 | $156,300 | $194,400 |
| 2020 | $3,136 | $313,600 | $153,800 | $159,800 |
| 2019 | $2,986 | $295,600 | $153,800 | $141,800 |
| 2018 | $2,948 | $286,500 | $144,700 | $141,800 |
| 2017 | $2,871 | $286,500 | $144,700 | $141,800 |
| 2016 | $2,859 | $286,500 | $144,700 | $141,800 |
| 2015 | $2,614 | $260,400 | $99,500 | $160,900 |
Source: Public Records
Map
Nearby Homes
- 26 Pebble Beach Way
- 19 Augusta Way
- 19 Pebble Beach Way
- 15 Augusta Way
- 25 Pebble Beach Way
- 15 Pebble Beach Way
- 10 Augusta Way
- 18 Tam-O-shanter Way
- 18 Tam o Shanter Way
- 14 Tam-O-shanter Way
- 14 Tam o Shanter Way
- 31 Pebble Beach Way
- 9 Pebble Beach Way
- 7 Augusta Way
- 258 N Main St
- 262 N Main St
- 24 Tam o Shanter Way
- 24 Tam-O-shanter Way
- 31 Augusta Way
- 252 N Main St