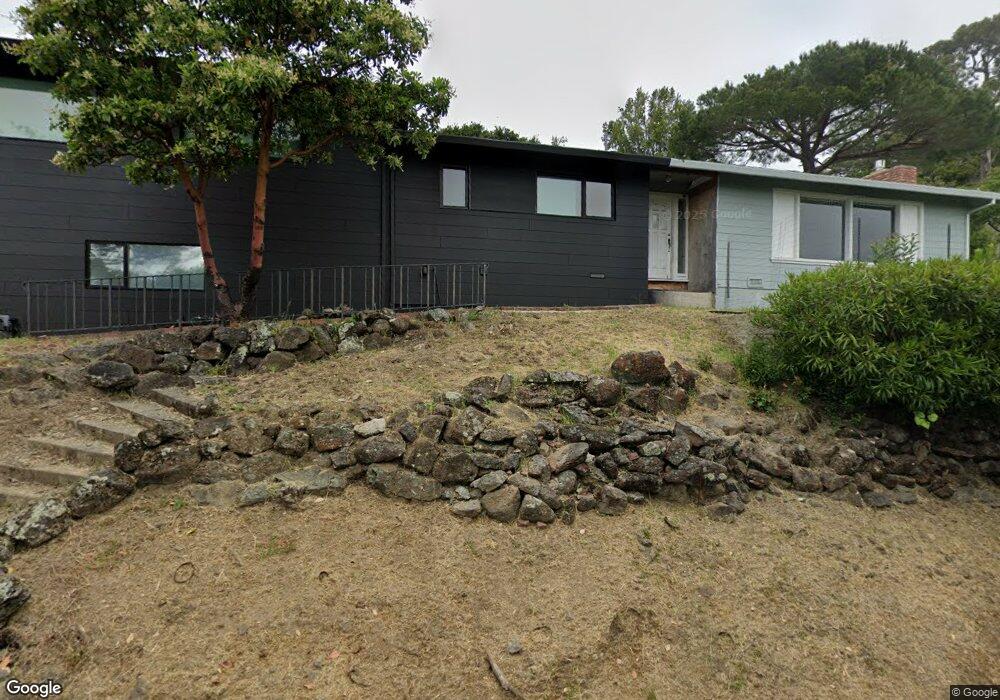
20 Pepper Way San Rafael, CA 94901
Lincoln-San Rafael Hill NeighborhoodEstimated Value: $1,437,000 - $1,568,000
3
Beds
3
Baths
1,811
Sq Ft
$830/Sq Ft
Est. Value
About This Home
This home is located at 20 Pepper Way, San Rafael, CA 94901 and is currently estimated at $1,502,711, approximately $829 per square foot. 20 Pepper Way is a home located in Marin County with nearby schools including Sun Valley Elementary School, James B. Davidson Middle School, and San Rafael High School.
Ownership History
Date
Name
Owned For
Owner Type
Purchase Details
Closed on
May 16, 2016
Sold by
Robertson Leonard B
Bought by
Saude Stephen and Saude Samina
Current Estimated Value
Home Financials for this Owner
Home Financials are based on the most recent Mortgage that was taken out on this home.
Original Mortgage
$94,420
Outstanding Balance
$74,968
Interest Rate
3.58%
Mortgage Type
Commercial
Estimated Equity
$1,427,743
Purchase Details
Closed on
Jul 31, 2012
Sold by
Robertson Leonard Bruce
Bought by
Robertson Leonard B and Robertson Anne M
Purchase Details
Closed on
Feb 20, 2002
Sold by
Robertson Leonard Bruce
Bought by
Robertson Leonard B and Robertson Anne M
Purchase Details
Closed on
May 12, 2000
Sold by
Robertson Mary Ellen
Bought by
Robertson Leonard Bruce
Purchase Details
Closed on
Nov 12, 1996
Sold by
Robertson Mary Ellen
Bought by
Robertson Mary Ellen and Robertson Leonard Bruce
Create a Home Valuation Report for This Property
The Home Valuation Report is an in-depth analysis detailing your home's value as well as a comparison with similar homes in the area
Home Values in the Area
Average Home Value in this Area
Purchase History
| Date | Buyer | Sale Price | Title Company |
|---|---|---|---|
| Saude Stephen | $800,000 | Old Republic Title Company | |
| Robertson Leonard B | -- | None Available | |
| Robertson Leonard B | -- | -- | |
| Robertson Leonard Bruce | -- | -- | |
| Robertson Mary Ellen | -- | -- | |
| Robertson Mary Ellen | -- | -- |
Source: Public Records
Mortgage History
| Date | Status | Borrower | Loan Amount |
|---|---|---|---|
| Open | Saude Stephen | $94,420 | |
| Open | Saude Stephen | $625,500 |
Source: Public Records
Tax History Compared to Growth
Tax History
| Year | Tax Paid | Tax Assessment Tax Assessment Total Assessment is a certain percentage of the fair market value that is determined by local assessors to be the total taxable value of land and additions on the property. | Land | Improvement |
|---|---|---|---|---|
| 2025 | $13,255 | $944,233 | $621,479 | $322,754 |
| 2024 | $13,255 | $925,720 | $609,294 | $316,426 |
| 2023 | $13,022 | $907,573 | $597,350 | $310,223 |
| 2022 | $12,315 | $889,778 | $585,637 | $304,141 |
| 2021 | $12,119 | $872,333 | $574,155 | $298,178 |
| 2020 | $11,996 | $863,391 | $568,270 | $295,121 |
| 2019 | $11,579 | $846,466 | $557,130 | $289,336 |
| 2018 | $11,465 | $829,875 | $546,210 | $283,665 |
| 2017 | $11,030 | $813,603 | $535,500 | $278,103 |
| 2016 | $3,016 | $131,480 | $43,475 | $88,005 |
| 2015 | $2,889 | $129,505 | $42,822 | $86,683 |
| 2014 | $2,744 | $126,969 | $41,983 | $84,986 |
Source: Public Records
Map
Nearby Homes
- 16 Oakmont Ave
- 272 Center St
- 119 Oakmont Ave
- 40 Leafwood Cir
- 55 Bayo Vista Way
- 51 El Camino Ave
- 0 Chula Vista Dr Unit 325048501
- 0 Chula Vista Dr Unit 325048505
- 0 Chula Vista Dr Unit 325048499
- 0 Chula Vista Dr Unit 325048503
- 0 Chula Vista Dr Unit 325048502
- 0 Chula Vista Dr Unit 325048500
- 0 Chula Vista Dr Unit 325048504
- 48 Ranch Rd
- 102 F St
- 2016 4th St
- 29 Red Rock Way
- 21 Red Rock Way
- 241 Humboldt St
- 14 Fair Dr
- 339 Fairhills Dr
- 335 Fairhills Dr
- 9 Pepper Way
- 331 Fairhills Dr
- 21 Pepper Way
- 25 Pepper Way
- 18 Pepper Way
- 212 Fairhills Dr
- 216 Fairhills Dr
- 338 Fairhills Dr
- 325 Fairhills Dr
- 343 Fairhills Dr
- 209 Fairhills Dr
- 20 Idlewood Place
- 24 Idlewood Place
- 208 Fairhills Dr
- 272 Fairhills Dr
- 328 Fairhills Dr
- 11 Twin Oaks Ave
- 271 Fairhills Dr