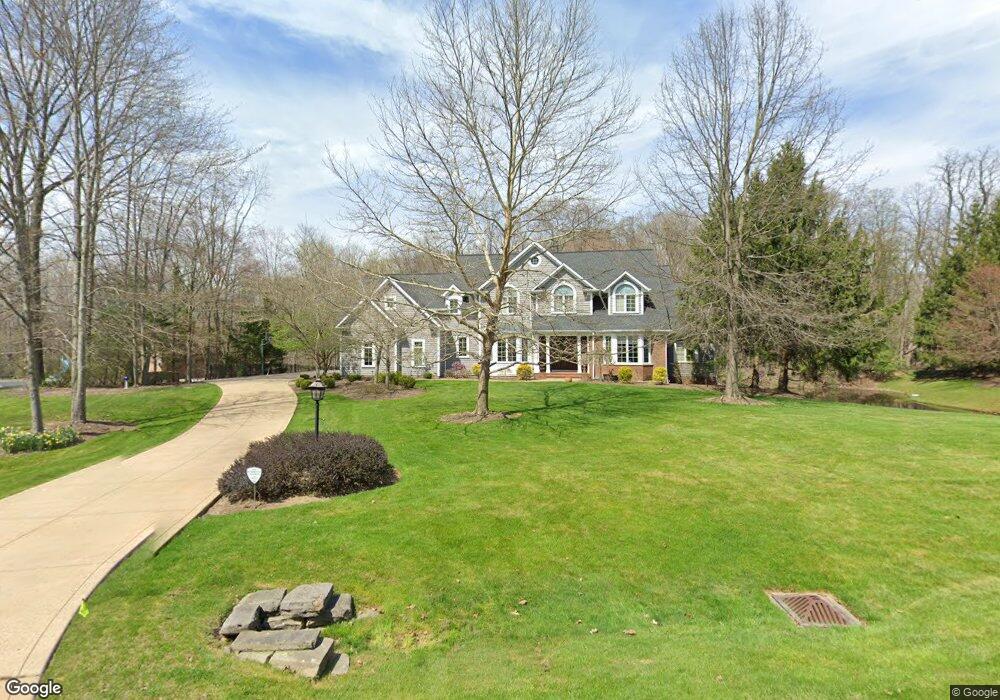
20 Pinecrest Dr Chagrin Falls, OH 44022
Estimated Value: $1,050,000 - $1,272,000
4
Beds
4
Baths
4,623
Sq Ft
$256/Sq Ft
Est. Value
About This Home
This home is located at 20 Pinecrest Dr, Chagrin Falls, OH 44022 and is currently estimated at $1,182,260, approximately $255 per square foot. 20 Pinecrest Dr is a home located in Cuyahoga County with nearby schools including Gurney Elementary School, Chagrin Falls Intermediate Elementary School, and Chagrin Falls Middle School.
Ownership History
Date
Name
Owned For
Owner Type
Purchase Details
Closed on
May 29, 2019
Sold by
Spain Henry A and Lazzaro Michele M
Bought by
Lazzaro Michele M and Spain Henry A
Current Estimated Value
Purchase Details
Closed on
May 4, 2005
Sold by
Primacy Closing Corp
Bought by
Spain Henry A and Lazzaro Michele M
Home Financials for this Owner
Home Financials are based on the most recent Mortgage that was taken out on this home.
Original Mortgage
$490,000
Interest Rate
6.07%
Mortgage Type
Purchase Money Mortgage
Purchase Details
Closed on
Aug 21, 2004
Sold by
Antonio Alex and Antonio Deborah
Bought by
Primacy Closing Corp
Purchase Details
Closed on
Apr 13, 2000
Sold by
Weimer Construction Co
Bought by
Antonio Alex and Antonio Deborah
Home Financials for this Owner
Home Financials are based on the most recent Mortgage that was taken out on this home.
Original Mortgage
$335,000
Interest Rate
7.5%
Purchase Details
Closed on
Jan 1, 1993
Bought by
Weimer Peter
Create a Home Valuation Report for This Property
The Home Valuation Report is an in-depth analysis detailing your home's value as well as a comparison with similar homes in the area
Home Values in the Area
Average Home Value in this Area
Purchase History
| Date | Buyer | Sale Price | Title Company |
|---|---|---|---|
| Lazzaro Michele M | -- | None Available | |
| Spain Henry A | $700,000 | First American Title Ins Co | |
| Primacy Closing Corp | $747,500 | First American Title Ins Co | |
| Antonio Alex | $685,000 | Insignia Title Agency Ltd | |
| Weimer Peter | -- | -- |
Source: Public Records
Mortgage History
| Date | Status | Borrower | Loan Amount |
|---|---|---|---|
| Closed | Spain Henry A | $490,000 | |
| Previous Owner | Antonio Alex | $335,000 |
Source: Public Records
Tax History
| Year | Tax Paid | Tax Assessment Tax Assessment Total Assessment is a certain percentage of the fair market value that is determined by local assessors to be the total taxable value of land and additions on the property. | Land | Improvement |
|---|---|---|---|---|
| 2025 | $19,935 | $326,095 | $50,225 | $275,870 |
| 2024 | $20,162 | $326,095 | $50,225 | $275,870 |
| 2023 | $21,786 | $295,510 | $52,680 | $242,830 |
| 2022 | $23,004 | $295,505 | $52,675 | $242,830 |
| 2021 | $22,908 | $295,510 | $52,680 | $242,830 |
| 2020 | $24,149 | $289,700 | $51,630 | $238,070 |
| 2019 | $23,792 | $827,700 | $147,500 | $680,200 |
| 2018 | $21,799 | $289,700 | $51,630 | $238,070 |
| 2017 | $22,244 | $259,220 | $35,600 | $223,620 |
| 2016 | $19,923 | $259,220 | $35,600 | $223,620 |
| 2015 | $20,218 | $259,220 | $35,600 | $223,620 |
| 2014 | $20,218 | $259,220 | $35,600 | $223,620 |
Source: Public Records
Map
Nearby Homes
- 145 Greenbrier Dr
- 16690 Dayton St
- 65 Quail Ridge Dr
- S/L Rocker Ave
- 315 Solon Rd Unit 309
- 7202 Woodland Ave
- 275 Solon Rd Unit 275C
- 16788 Geneva St
- 318 Hillside Ln
- 81 Hall St
- 225 S Main St
- 219 S Main St
- 6331 Chagrin River Rd
- 213 S Main St
- 207 S Main St
- 40 Highland Ln
- 106 Solon Rd
- 26 Water St
- 106 W Washington St
- 110 Emilia Ct
- 170 Grey Fox Run
- 180 Grey Fox Run
- 40 Pinecrest Dr
- 25 Pinecrest Dr
- 160 Grey Fox Run
- 35 Pinecrest Dr
- 215 Grey Fox Run
- 190 Grey Fox Run
- 497 Somerset Dr
- 205 Grey Fox Run
- 150 Grey Fox Run
- 10 Quail Ridge
- 133 Hawthorne Dr
- 483 Somerset Dr
- 473 Somerset Dr
- 20 Quail Ridge
- VL Franklin St
- 195 Grey Fox Run
- 147 Hawthorne Dr
- 463 Somerset Dr
Your Personal Tour Guide
Ask me questions while you tour the home.