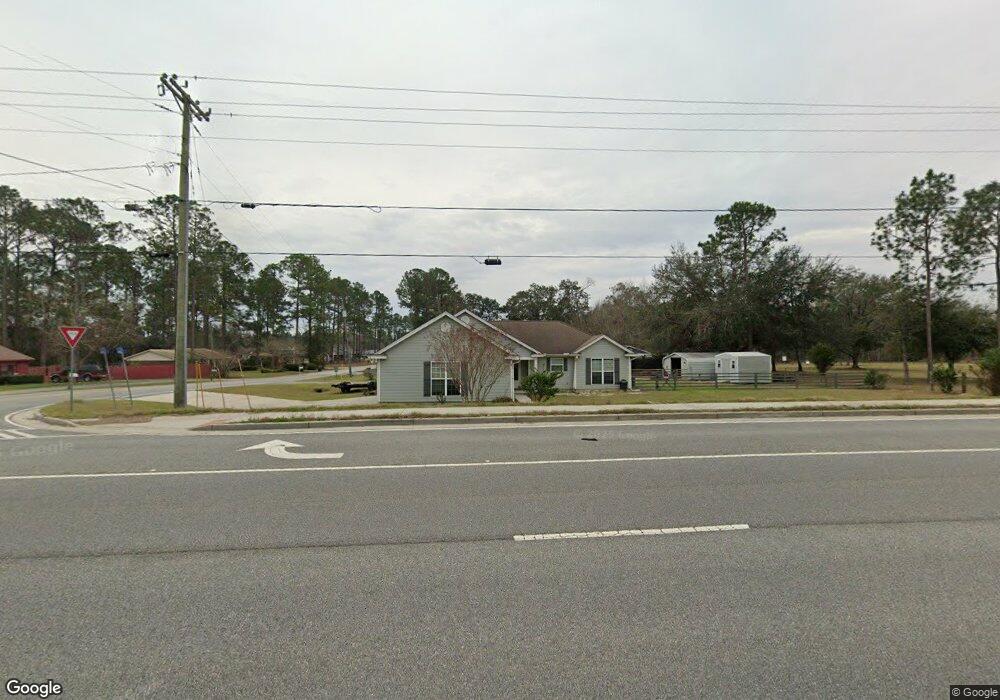
20 Pinedale Cir Valdosta, GA 31602
Estimated Value: $189,000 - $253,000
3
Beds
2
Baths
1,436
Sq Ft
$147/Sq Ft
Est. Value
About This Home
This home is located at 20 Pinedale Cir, Valdosta, GA 31602 and is currently estimated at $211,444, approximately $147 per square foot. 20 Pinedale Cir is a home located in Brooks County with nearby schools including North Brooks Elementary School.
Ownership History
Date
Name
Owned For
Owner Type
Purchase Details
Closed on
Nov 14, 2019
Sold by
Croft Jajuan W
Bought by
Croft Michael J
Current Estimated Value
Purchase Details
Closed on
Feb 17, 2014
Sold by
Croft Jajuan W
Bought by
Georgia Department Of Transportation
Purchase Details
Closed on
Apr 17, 2006
Sold by
Blanton Cathy
Bought by
Croft Jajuan W
Purchase Details
Closed on
Mar 14, 2005
Sold by
Cowart J C
Bought by
Blanton Cathy and Blanton Raymond
Purchase Details
Closed on
Jul 12, 2002
Sold by
Sugar Bear Inc
Bought by
Cowart J C
Purchase Details
Closed on
Jan 8, 2001
Sold by
Henrico Mk Llc
Bought by
Sugar Bear Inc
Purchase Details
Closed on
Oct 5, 2000
Sold by
Sugar Bear Inc
Bought by
Henrico Mk Llc
Purchase Details
Closed on
Feb 20, 1995
Sold by
Circle K Corp
Bought by
Sugar Bear Inc
Purchase Details
Closed on
Sep 30, 1994
Sold by
Shop & Go Inc
Bought by
Circle K Corp
Purchase Details
Closed on
Mar 12, 1981
Bought by
Shop & Go Inc
Create a Home Valuation Report for This Property
The Home Valuation Report is an in-depth analysis detailing your home's value as well as a comparison with similar homes in the area
Home Values in the Area
Average Home Value in this Area
Purchase History
| Date | Buyer | Sale Price | Title Company |
|---|---|---|---|
| Croft Michael J | -- | -- | |
| Georgia Department Of Transportation | -- | -- | |
| Croft Jajuan W | $130,450 | -- | |
| Blanton Cathy | $15,000 | -- | |
| Cowart J C | $11,000 | -- | |
| Sugar Bear Inc | -- | -- | |
| Henrico Mk Llc | $9,000 | -- | |
| Sugar Bear Inc | $5,500 | -- | |
| Circle K Corp | -- | -- | |
| Shop & Go Inc | -- | -- |
Source: Public Records
Tax History Compared to Growth
Tax History
| Year | Tax Paid | Tax Assessment Tax Assessment Total Assessment is a certain percentage of the fair market value that is determined by local assessors to be the total taxable value of land and additions on the property. | Land | Improvement |
|---|---|---|---|---|
| 2024 | $1,611 | $56,660 | $4,631 | $52,029 |
| 2023 | $1,153 | $56,660 | $4,631 | $52,029 |
| 2022 | $1,499 | $56,660 | $4,520 | $52,140 |
| 2021 | $1,423 | $46,980 | $4,320 | $42,660 |
| 2020 | $1,318 | $47,460 | $4,080 | $43,380 |
| 2019 | $1,218 | $41,020 | $4,320 | $36,700 |
| 2018 | $1,224 | $41,900 | $4,320 | $37,580 |
| 2017 | $1,299 | $39,300 | $5,080 | $34,220 |
| 2016 | $1,342 | $39,700 | $5,080 | $34,620 |
| 2015 | -- | $40,140 | $5,080 | $35,060 |
| 2014 | -- | $48,140 | $6,000 | $42,140 |
| 2013 | -- | $48,140 | $6,000 | $42,140 |
Source: Public Records
Map
Nearby Homes
- 51 Quail Dr
- 786 Parkview Cir
- 91 Pine Forest Dr
- 159 Ridgeland Dr
- 212 Hilltop Cir
- 16000 Valdosta Hwy
- 8262 Troupeville Rd
- 4301 Shiloh Trace
- 4311 Shiloh Trace
- Tract 2 SW I-75 Exit 22 Se North Valdosta Rd & Val Tech Rd
- Tract 3 SW I-75 Exit 22 Sw Shiloh Rd & Val Tech Rd
- 6818 Troupeville Rd
- 3904 Timber Ridge Rd
- 3906 Loblolly Ln
- 3924 Timber Ridge Rd
- Tract 1 SE I-75 Exit 22 North Valdosta Rd & Flythe Rd
- 17 Green Lake Cir
- 3998 Trailhead Point
- 3897 Bear Hollow
- 4073 Quail Run Cir
- 52 Pinedale Cir
- 1 Pinedale Cir
- 41 Pinedale Cir
- 70 Pinedale Cir
- 17399 Valdosta Hwy
- 61 Pinedale Cir
- 17395 Valdosta Hwy
- 17480 Valdosta Hwy
- 90 Pinedale Cir
- 0 Highway 133
- 35 Greenridge St
- 17455 Valdosta Hwy
- 10 Greenridge St
- 56 Greenridge St
- 17508 Valdosta Hwy
- 28 Quail Dr
- 120 Pinedale Cir
- 17 Old Home Place
- 85 Greenridge St
- 479 Pinedale Cir