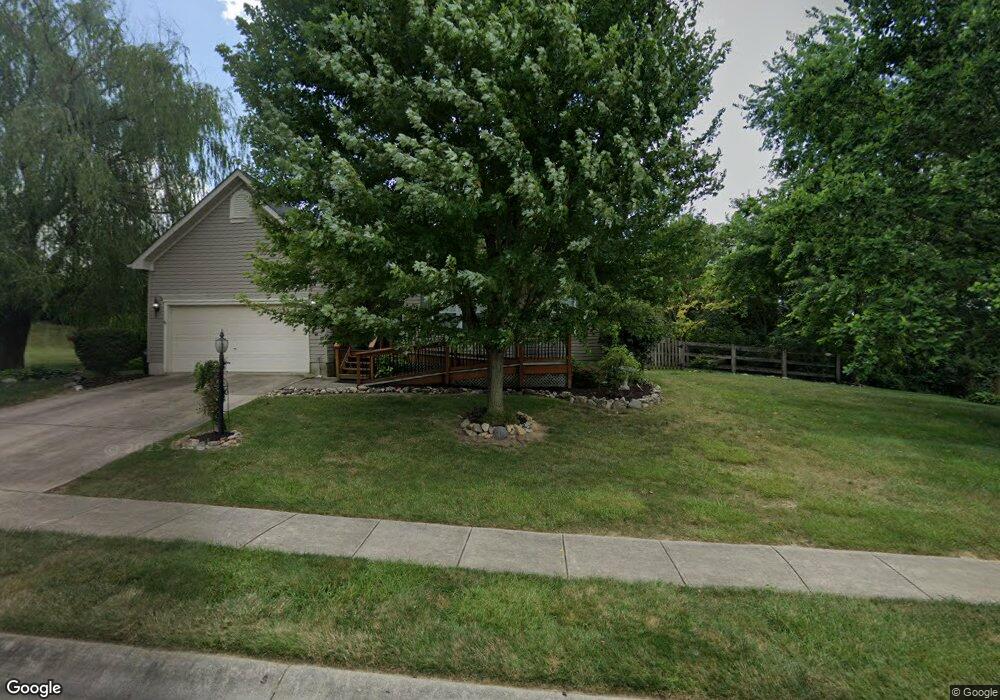
20 Pleasant Hill Blvd Franklin, OH 45005
Estimated Value: $312,325 - $330,000
3
Beds
2
Baths
1,640
Sq Ft
$197/Sq Ft
Est. Value
About This Home
This home is located at 20 Pleasant Hill Blvd, Franklin, OH 45005 and is currently estimated at $323,331, approximately $197 per square foot. 20 Pleasant Hill Blvd is a home located in Warren County with nearby schools including Franklin High School, Summit Academy Community School for Alternative Learners - Middletown, and Summit Academy Secondary School - Middletown.
Ownership History
Date
Name
Owned For
Owner Type
Purchase Details
Closed on
Jul 1, 2025
Sold by
Fecke Robert M
Bought by
Robert Martin Fecke Trust and Fecke
Current Estimated Value
Purchase Details
Closed on
Oct 7, 2019
Sold by
Fecke Robert M
Bought by
Fecke Robert M and Fecke Family Trust
Purchase Details
Closed on
May 26, 2015
Sold by
Fecke Robert M and Fecke Jennifer L
Bought by
Fecke Robert M and Fecke Jennifer L
Purchase Details
Closed on
May 19, 2006
Sold by
Nvr Inc
Bought by
Fecke Robert M
Home Financials for this Owner
Home Financials are based on the most recent Mortgage that was taken out on this home.
Original Mortgage
$143,687
Interest Rate
6.62%
Mortgage Type
Purchase Money Mortgage
Purchase Details
Closed on
Feb 23, 2006
Sold by
Hdc Iii Llc
Bought by
Nvr Inc
Create a Home Valuation Report for This Property
The Home Valuation Report is an in-depth analysis detailing your home's value as well as a comparison with similar homes in the area
Home Values in the Area
Average Home Value in this Area
Purchase History
| Date | Buyer | Sale Price | Title Company |
|---|---|---|---|
| Robert Martin Fecke Trust | -- | None Listed On Document | |
| Fecke Robert M | -- | None Listed On Document | |
| Fecke Robert M | -- | None Available | |
| Fecke Robert M | -- | Attorney | |
| Fecke Robert M | $179,633 | First Title Agency Inc | |
| Nvr Inc | $23,500 | First Title |
Source: Public Records
Mortgage History
| Date | Status | Borrower | Loan Amount |
|---|---|---|---|
| Previous Owner | Fecke Robert M | $143,687 |
Source: Public Records
Tax History Compared to Growth
Tax History
| Year | Tax Paid | Tax Assessment Tax Assessment Total Assessment is a certain percentage of the fair market value that is determined by local assessors to be the total taxable value of land and additions on the property. | Land | Improvement |
|---|---|---|---|---|
| 2024 | $4,048 | $86,030 | $24,500 | $61,530 |
| 2023 | $3,542 | $67,525 | $12,915 | $54,610 |
| 2022 | $3,474 | $67,526 | $12,915 | $54,611 |
| 2021 | $3,294 | $67,526 | $12,915 | $54,611 |
| 2020 | $3,036 | $54,898 | $10,500 | $44,398 |
| 2019 | $2,761 | $54,898 | $10,500 | $44,398 |
| 2018 | $2,723 | $54,898 | $10,500 | $44,398 |
| 2017 | $2,581 | $46,869 | $8,320 | $38,549 |
| 2016 | $2,631 | $46,869 | $8,320 | $38,549 |
| 2015 | $2,631 | $46,869 | $8,320 | $38,549 |
| 2014 | $2,587 | $45,500 | $8,080 | $37,430 |
| 2013 | $2,221 | $59,140 | $10,500 | $48,640 |
Source: Public Records
Map
Nearby Homes
- 60 Pleasant Hill Blvd
- 25 Timber Creek Dr
- 220 Pleasant Hill Blvd
- 5756 Union Rd
- 5845 Manchester Rd
- 0 Kathy Ln Unit 1834240
- 0 Kathy Ln Unit 930066
- 5696 Woodcreek Dr
- 6772 Rivulet Dr
- 1117 S Main St
- 5714 Millbrook Dr
- 5667 Woodcreek Dr
- 1010 S Main St
- 218 Roberts Ave
- 7 Brown St
- 1007 S River St
- 5760 Autumn Dr
- 6777 Crystal Harbour Dr
- 6795 Crystal Harbour Dr
- 187 Minnick St
- 21 Pleasant Hill Blvd
- 40 Pleasant Hill Blvd
- 15 Hancock Cove
- 12 Hancock Cove
- 6251 Shaker Rd
- 50 Pleasant Hill Blvd
- 22 Hancock Cove
- 25 Hancock Cove
- 32 Hancock Cove
- 61 Pleasant Hill Blvd
- 35 Hancock Cove
- 6271 Shaker Rd
- 70 Pleasant Hill Blvd
- 42 Hancock Cove
- 6256 Shaker Rd
- 45 Hancock Cove
- 71 Pleasant Hill Blvd
- 80 Pleasant Hill Blvd
- 52 Hancock Cove
- 65 Hancock Cove