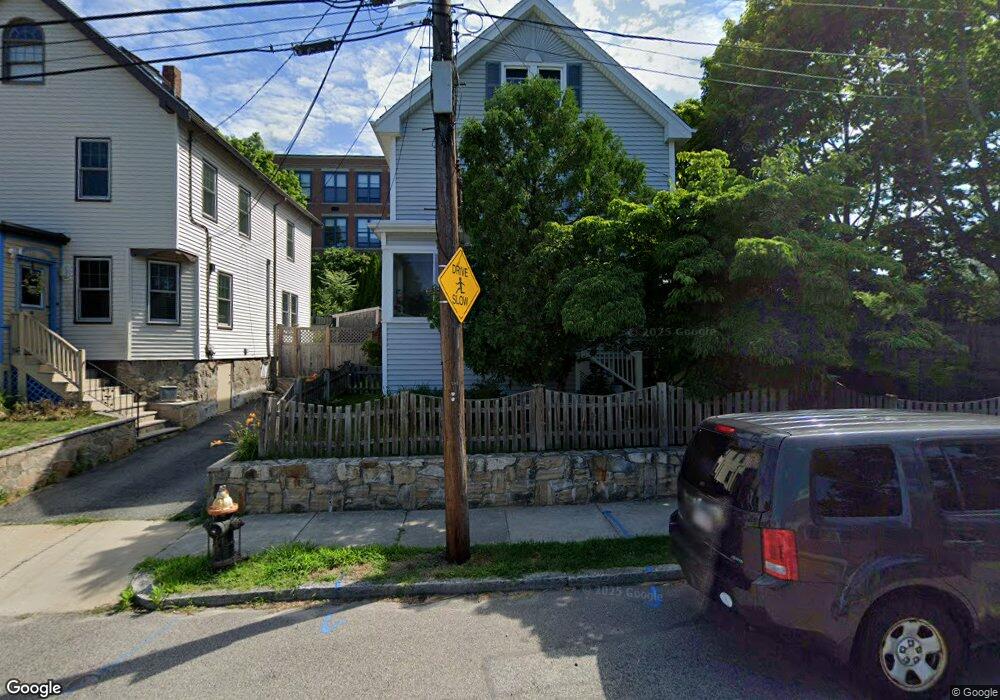
20 Preston Rd West Roxbury, MA 02132
West Roxbury NeighborhoodEstimated Value: $808,550 - $970,000
3
Beds
2
Baths
2,024
Sq Ft
$436/Sq Ft
Est. Value
About This Home
This home is located at 20 Preston Rd, West Roxbury, MA 02132 and is currently estimated at $882,388, approximately $435 per square foot. 20 Preston Rd is a home located in Suffolk County with nearby schools including St Theresa School, Holy Name Parish School, and The Roxbury Latin School.
Ownership History
Date
Name
Owned For
Owner Type
Purchase Details
Closed on
Jul 1, 2008
Sold by
Mcintyre James P and Mcintyre Michelle G
Bought by
Atakov Alex F and Castillo Astrid S
Current Estimated Value
Home Financials for this Owner
Home Financials are based on the most recent Mortgage that was taken out on this home.
Original Mortgage
$324,800
Interest Rate
6.07%
Mortgage Type
Purchase Money Mortgage
Purchase Details
Closed on
Aug 3, 1998
Sold by
Jhamb Kristin K
Bought by
Mcintyre Michelle G and Mcintyre James P
Home Financials for this Owner
Home Financials are based on the most recent Mortgage that was taken out on this home.
Original Mortgage
$227,150
Interest Rate
6.92%
Mortgage Type
Purchase Money Mortgage
Purchase Details
Closed on
Jun 23, 1992
Sold by
Turner James and Groth Janet
Bought by
Jhamb Kristin K
Create a Home Valuation Report for This Property
The Home Valuation Report is an in-depth analysis detailing your home's value as well as a comparison with similar homes in the area
Home Values in the Area
Average Home Value in this Area
Purchase History
| Date | Buyer | Sale Price | Title Company |
|---|---|---|---|
| Atakov Alex F | $406,000 | -- | |
| Mcintyre Michelle G | $240,000 | -- | |
| Jhamb Kristin K | $135,000 | -- |
Source: Public Records
Mortgage History
| Date | Status | Borrower | Loan Amount |
|---|---|---|---|
| Open | Jhamb Kristin K | $324,000 | |
| Closed | Jhamb Kristin K | $324,800 | |
| Closed | Atakov Alex F | $324,800 | |
| Previous Owner | Jhamb Kristin K | $207,000 | |
| Previous Owner | Jhamb Kristin K | $227,150 |
Source: Public Records
Tax History Compared to Growth
Tax History
| Year | Tax Paid | Tax Assessment Tax Assessment Total Assessment is a certain percentage of the fair market value that is determined by local assessors to be the total taxable value of land and additions on the property. | Land | Improvement |
|---|---|---|---|---|
| 2025 | $7,514 | $648,900 | $202,600 | $446,300 |
| 2024 | $6,394 | $586,600 | $188,400 | $398,200 |
| 2023 | $6,114 | $569,300 | $182,800 | $386,500 |
| 2022 | $5,630 | $517,500 | $166,200 | $351,300 |
| 2021 | $5,201 | $487,400 | $158,300 | $329,100 |
| 2020 | $5,146 | $487,300 | $147,700 | $339,600 |
| 2019 | $4,919 | $466,700 | $126,000 | $340,700 |
| 2018 | $4,529 | $432,200 | $126,000 | $306,200 |
| 2017 | $4,486 | $423,600 | $126,000 | $297,600 |
| 2016 | $4,314 | $392,200 | $126,000 | $266,200 |
| 2015 | $4,644 | $383,500 | $141,100 | $242,400 |
| 2014 | $4,551 | $361,800 | $141,100 | $220,700 |
Source: Public Records
Map
Nearby Homes
- 425 Lagrange St Unit 203
- 73 Dent St Unit 1
- 76 Potomac St
- 539 Lagrange St
- 54 Sturges Rd
- 27-29 Temple St
- 348 Lagrange St
- 110 Park St Unit 3
- 14 Sanborn Ave
- 37 Hastings St Unit 103
- 183 Temple St
- 59 Chesbrough Rd
- 28 Dow Rd
- 76 Vermont St
- 340 Baker St Unit 1
- 105 Chesbrough Rd
- 1789 Centre St Unit 202
- 9 Carroll St
- 231 Lagrange St
- 331 Vermont St
- 18 Preston Rd
- 32 Chapin Ave
- 16 Preston Rd
- 16 Preston Rd Unit 1
- 20 Chapin Ave
- 14 Preston Rd
- 14 Preston Rd Unit 1
- 16 Chapin Ave
- 15 Preston Rd
- 12 Preston Rd
- 12 Preston Rd Unit 2
- 10 Preston Rd
- 10 Preston Rd Unit 2
- 10 Preston Rd Unit 1
- 11 Preston Rd
- 12 Chapin Ave
- 8 Preston Rd
- 9 Preston Rd
- 461 Lagrange St
- 465 Lagrange St