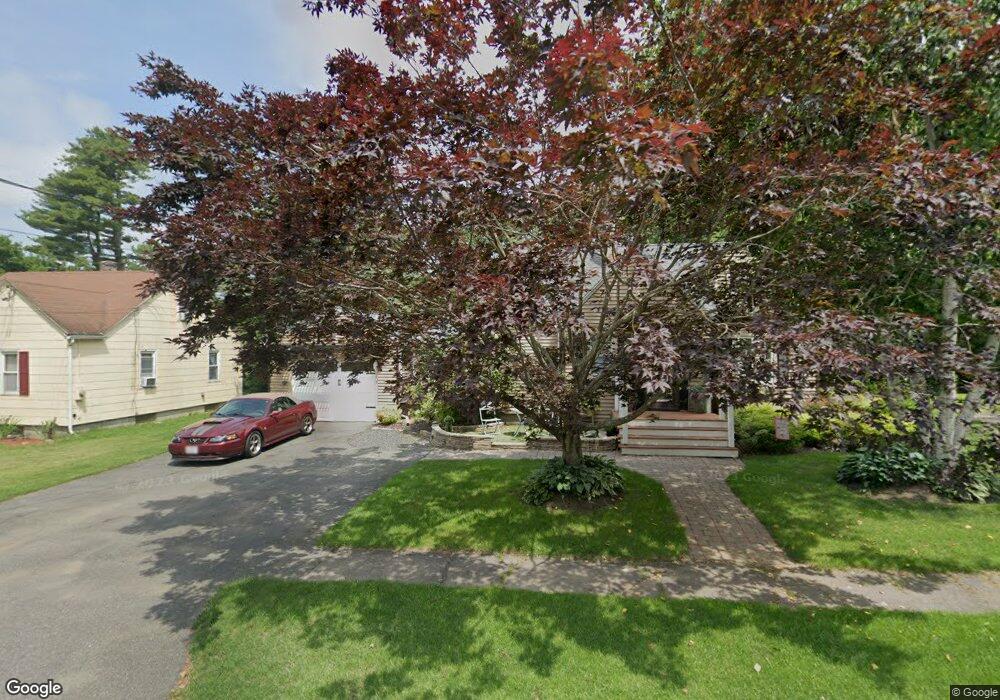
20 Queen Cir South Hadley, MA 01075
Estimated Value: $315,000 - $363,952
2
Beds
1
Bath
1,400
Sq Ft
$237/Sq Ft
Est. Value
About This Home
This home is located at 20 Queen Cir, South Hadley, MA 01075 and is currently estimated at $332,488, approximately $237 per square foot. 20 Queen Cir is a home located in Hampshire County with nearby schools including Plains Elementary School, Mosier Elementary School, and Michael E. Smith Middle School.
Ownership History
Date
Name
Owned For
Owner Type
Purchase Details
Closed on
May 10, 2023
Sold by
Ottomaniello N J
Bought by
Ottomaniello N J N and Ottomaniello Kimberly
Current Estimated Value
Home Financials for this Owner
Home Financials are based on the most recent Mortgage that was taken out on this home.
Original Mortgage
$75,000
Outstanding Balance
$72,869
Interest Rate
6.27%
Mortgage Type
Stand Alone Refi Refinance Of Original Loan
Estimated Equity
$259,619
Purchase Details
Closed on
Nov 1, 2011
Sold by
Buckley Linda Mr
Bought by
Kohl Jean A
Purchase Details
Closed on
Apr 15, 1998
Sold by
Easthampton Sb
Bought by
Ottomaniello Kimberly and Ottomaniello Nicholas
Purchase Details
Closed on
Feb 27, 1998
Sold by
Moses Lori G and Sorrese Joyce D
Bought by
Easthampton Sb
Purchase Details
Closed on
Sep 15, 1995
Sold by
Curtis Linda L and Rosskothen Linda
Bought by
Moses Lori G and Sorresse Joyce D
Create a Home Valuation Report for This Property
The Home Valuation Report is an in-depth analysis detailing your home's value as well as a comparison with similar homes in the area
Home Values in the Area
Average Home Value in this Area
Purchase History
| Date | Buyer | Sale Price | Title Company |
|---|---|---|---|
| Ottomaniello N J N | -- | None Available | |
| Ottomaniello N J N | -- | None Available | |
| Kohl Jean A | $155,500 | -- | |
| Ottomaniello Kimberly | $109,000 | -- | |
| Easthampton Sb | $106,404 | -- | |
| Moses Lori G | $114,001 | -- | |
| Kohl Jean A | $155,500 | -- | |
| Ottomaniello Kimberly | $109,000 | -- | |
| Easthampton Sb | $106,404 | -- | |
| Moses Lori G | $114,001 | -- |
Source: Public Records
Mortgage History
| Date | Status | Borrower | Loan Amount |
|---|---|---|---|
| Open | Ottomaniello N J N | $75,000 | |
| Closed | Ottomaniello N J N | $75,000 | |
| Previous Owner | Moses Lori G | $166,000 | |
| Previous Owner | Moses Lori G | $38,000 |
Source: Public Records
Tax History Compared to Growth
Tax History
| Year | Tax Paid | Tax Assessment Tax Assessment Total Assessment is a certain percentage of the fair market value that is determined by local assessors to be the total taxable value of land and additions on the property. | Land | Improvement |
|---|---|---|---|---|
| 2025 | $4,929 | $309,400 | $97,200 | $212,200 |
| 2024 | $4,799 | $288,200 | $90,800 | $197,400 |
| 2023 | $4,312 | $245,700 | $82,600 | $163,100 |
| 2022 | $4,108 | $222,300 | $82,600 | $139,700 |
| 2021 | $4,044 | $207,800 | $77,200 | $130,600 |
| 2020 | $3,962 | $198,700 | $77,200 | $121,500 |
| 2019 | $3,861 | $191,600 | $73,500 | $118,100 |
| 2018 | $3,711 | $186,200 | $71,300 | $114,900 |
| 2017 | $3,581 | $178,000 | $71,300 | $106,700 |
| 2016 | $3,517 | $177,200 | $71,300 | $105,900 |
| 2015 | $3,335 | $172,100 | $69,200 | $102,900 |
Source: Public Records
Map
Nearby Homes