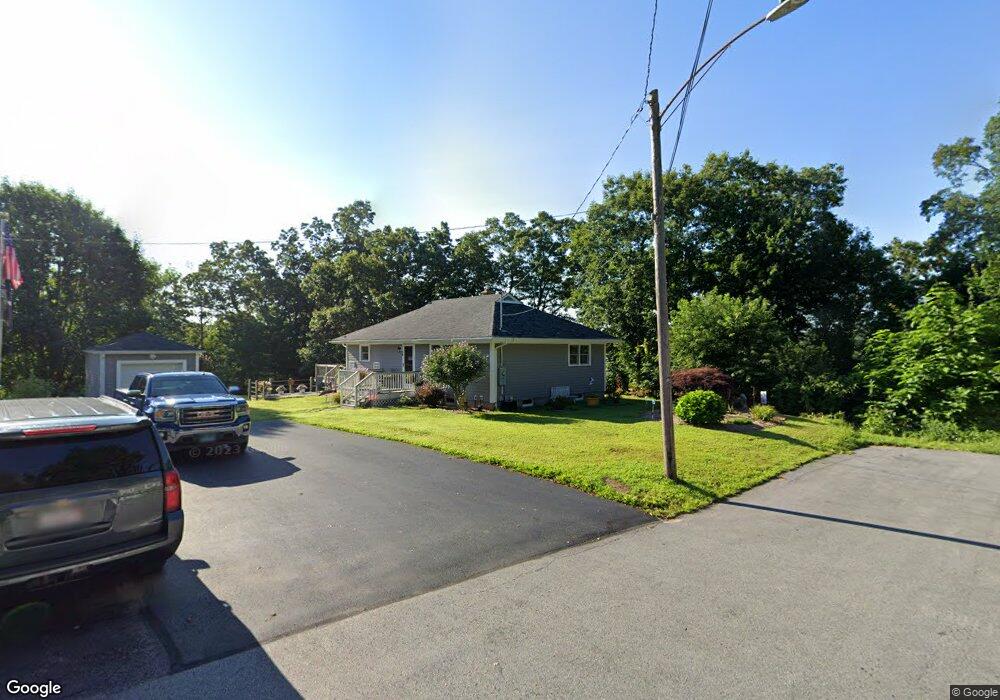
20 Ray St Putnam, CT 06260
Estimated Value: $265,000 - $292,000
1
Bed
1
Bath
1,040
Sq Ft
$273/Sq Ft
Est. Value
About This Home
This home is located at 20 Ray St, Putnam, CT 06260 and is currently estimated at $284,048, approximately $273 per square foot. 20 Ray St is a home located in Windham County with nearby schools including Putnam Elementary School, Putnam Middle School, and Putnam High School.
Ownership History
Date
Name
Owned For
Owner Type
Purchase Details
Closed on
Apr 9, 2008
Sold by
Johnson Brian L
Bought by
Dawley Timothy L and Dawley Wendy M
Current Estimated Value
Home Financials for this Owner
Home Financials are based on the most recent Mortgage that was taken out on this home.
Original Mortgage
$155,000
Outstanding Balance
$99,863
Interest Rate
6.3%
Estimated Equity
$184,185
Purchase Details
Closed on
Mar 28, 1991
Sold by
Mathieu Leonie Est
Bought by
Johnson Brian
Home Financials for this Owner
Home Financials are based on the most recent Mortgage that was taken out on this home.
Original Mortgage
$81,400
Interest Rate
8.5%
Mortgage Type
Unknown
Create a Home Valuation Report for This Property
The Home Valuation Report is an in-depth analysis detailing your home's value as well as a comparison with similar homes in the area
Home Values in the Area
Average Home Value in this Area
Purchase History
| Date | Buyer | Sale Price | Title Company |
|---|---|---|---|
| Dawley Timothy L | $155,000 | -- | |
| Johnson Brian | $81,400 | -- |
Source: Public Records
Mortgage History
| Date | Status | Borrower | Loan Amount |
|---|---|---|---|
| Open | Johnson Brian | $155,000 | |
| Previous Owner | Johnson Brian | $112,000 | |
| Previous Owner | Johnson Brian | $80,000 | |
| Previous Owner | Johnson Brian | $81,400 |
Source: Public Records
Tax History
| Year | Tax Paid | Tax Assessment Tax Assessment Total Assessment is a certain percentage of the fair market value that is determined by local assessors to be the total taxable value of land and additions on the property. | Land | Improvement |
|---|---|---|---|---|
| 2025 | $4,406 | $173,800 | $28,100 | $145,700 |
| 2024 | $4,938 | $149,000 | $28,100 | $120,900 |
| 2023 | $3,042 | $95,700 | $21,300 | $74,400 |
| 2022 | $2,937 | $95,700 | $21,300 | $74,400 |
| 2021 | $2,856 | $95,700 | $21,300 | $74,400 |
| 2020 | $2,856 | $95,700 | $21,300 | $74,400 |
| 2019 | $2,742 | $86,600 | $25,300 | $61,300 |
| 2018 | $2,636 | $86,600 | $25,300 | $61,300 |
| 2017 | $2,546 | $86,600 | $25,300 | $61,300 |
| 2016 | $2,290 | $86,600 | $25,300 | $61,300 |
| 2015 | $2,228 | $86,300 | $25,300 | $61,000 |
| 2014 | $2,413 | $102,800 | $37,900 | $64,900 |
Source: Public Records
Map
Nearby Homes
Your Personal Tour Guide
Ask me questions while you tour the home.