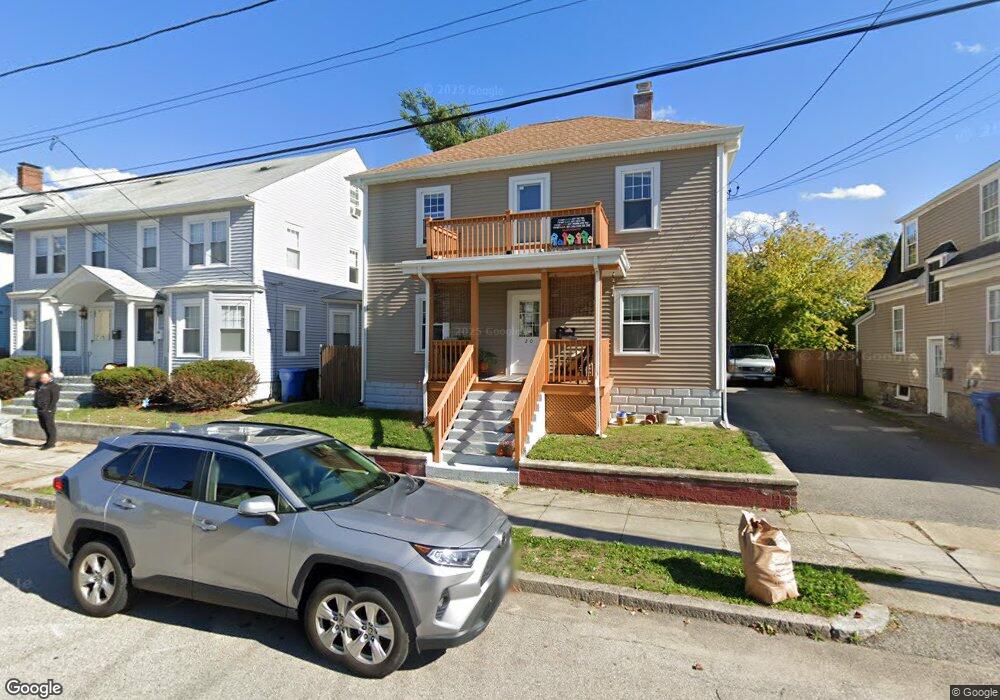
20 Richard St Cranston, RI 02910
Auburn NeighborhoodEstimated Value: $418,388 - $491,000
4
Beds
2
Baths
1,526
Sq Ft
$303/Sq Ft
Est. Value
About This Home
This home is located at 20 Richard St, Cranston, RI 02910 and is currently estimated at $462,597, approximately $303 per square foot. 20 Richard St is a home located in Providence County with nearby schools including Eden Park Elementary School, Park View Middle School, and Cranston High School East.
Ownership History
Date
Name
Owned For
Owner Type
Purchase Details
Closed on
Sep 14, 2017
Sold by
Mcloughlin Brian J and Mcloughlin Kristen
Bought by
Mcloughlin Kristen E
Current Estimated Value
Purchase Details
Closed on
Dec 2, 2011
Sold by
Bank Of New York Mello
Bought by
Hagopian Sarkis
Purchase Details
Closed on
Jan 21, 2010
Sold by
Cannistraci Joseph J and Bank Of New York Mello
Bought by
Bank Of New York Mello
Create a Home Valuation Report for This Property
The Home Valuation Report is an in-depth analysis detailing your home's value as well as a comparison with similar homes in the area
Home Values in the Area
Average Home Value in this Area
Purchase History
| Date | Buyer | Sale Price | Title Company |
|---|---|---|---|
| Mcloughlin Kristen E | -- | -- | |
| Hagopian Sarkis | $74,949 | -- | |
| Bank Of New York Mello | $125,000 | -- |
Source: Public Records
Mortgage History
| Date | Status | Borrower | Loan Amount |
|---|---|---|---|
| Open | Bank Of New York Mello | $121,800 | |
| Previous Owner | Bank Of New York Mello | $70,000 |
Source: Public Records
Tax History Compared to Growth
Tax History
| Year | Tax Paid | Tax Assessment Tax Assessment Total Assessment is a certain percentage of the fair market value that is determined by local assessors to be the total taxable value of land and additions on the property. | Land | Improvement |
|---|---|---|---|---|
| 2025 | $4,751 | $342,300 | $93,600 | $248,700 |
| 2024 | $4,659 | $342,300 | $93,600 | $248,700 |
| 2023 | $4,438 | $234,800 | $64,600 | $170,200 |
| 2022 | $4,346 | $234,800 | $64,600 | $170,200 |
| 2021 | $4,226 | $234,800 | $64,600 | $170,200 |
| 2020 | $3,911 | $188,300 | $61,300 | $127,000 |
| 2019 | $3,859 | $185,800 | $61,300 | $124,500 |
| 2018 | $3,770 | $185,800 | $61,300 | $124,500 |
| 2017 | $3,391 | $147,800 | $45,200 | $102,600 |
| 2016 | $3,318 | $147,800 | $45,200 | $102,600 |
| 2015 | $3,318 | $147,800 | $45,200 | $102,600 |
| 2014 | $2,958 | $129,500 | $45,200 | $84,300 |
Source: Public Records
Map
Nearby Homes
- 1 Rolfe Square
- 51 Norfolk St
- 75 High School Ave
- 124 Clarence St
- 483 Pontiac Ave
- 152 Woodbine St
- 36 Blackamore Ave
- 115 Norfolk St
- 128 Elsie St
- 140 Eldridge St
- 129 Wollaston St
- 130 Wollaston St
- 140 Concord Ave
- 18 Glenwood Ave
- 12 Stevens Rd
- 136 Frankfort St
- 74 Leslie St
- 41 Cottage St
- 638 Pontiac Ave
- 105 Broadmoor Rd