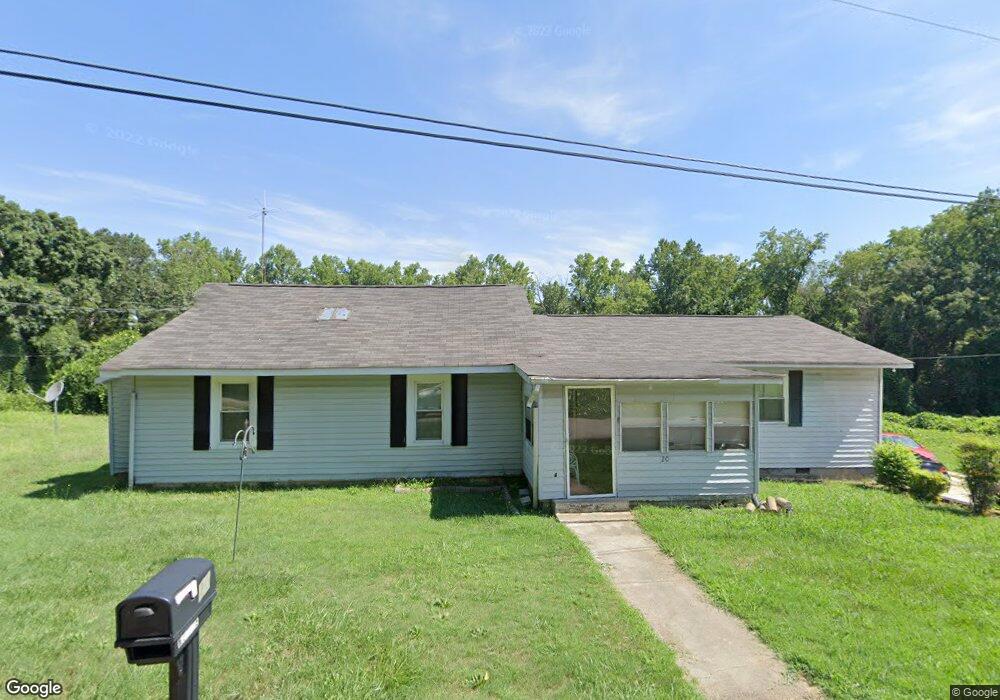
20 Riverside Dr Taylors, SC 29687
Estimated Value: $246,000 - $329,000
3
Beds
2
Baths
1,800
Sq Ft
$153/Sq Ft
Est. Value
About This Home
This home is located at 20 Riverside Dr, Taylors, SC 29687 and is currently estimated at $275,564, approximately $153 per square foot. 20 Riverside Dr is a home located in Greenville County with nearby schools including Taylors Elementary School, Northwood Middle School, and Riverside High School.
Ownership History
Date
Name
Owned For
Owner Type
Purchase Details
Closed on
Oct 3, 2024
Sold by
Nance Debra D
Bought by
Case Joshua David and Case Naomi Rebecca
Current Estimated Value
Purchase Details
Closed on
Nov 16, 2022
Sold by
Durham Betty Ann
Bought by
Kearse Betty Ann and Nance Debra D
Purchase Details
Closed on
Aug 31, 2022
Sold by
Violet Davis
Bought by
Kearse Betty Ann
Purchase Details
Closed on
Aug 30, 2022
Sold by
Sherica Kearse
Bought by
Kearse Betty Ann
Purchase Details
Closed on
Aug 16, 2022
Sold by
Kearse Stanley M
Bought by
Kearse Betty Ann
Purchase Details
Closed on
Oct 29, 2021
Sold by
Kearse Betty and Estate Of Matthews Kearse
Bought by
Kearse Betty Ann and Kearse Stanley M
Purchase Details
Closed on
Aug 13, 2021
Sold by
Kearse Betty A and Estate Of Matthews Kearse
Bought by
Davis Violet and Makins Letitia
Purchase Details
Closed on
Jan 31, 2002
Sold by
Durham Betty Ann Nka Betty Ann Kearse
Bought by
Kearse Matthew
Create a Home Valuation Report for This Property
The Home Valuation Report is an in-depth analysis detailing your home's value as well as a comparison with similar homes in the area
Home Values in the Area
Average Home Value in this Area
Purchase History
| Date | Buyer | Sale Price | Title Company |
|---|---|---|---|
| Case Joshua David | $20,000 | None Listed On Document | |
| Kearse Betty Ann | -- | -- | |
| Kearse Betty Ann | -- | -- | |
| Kearse Betty Ann | -- | None Listed On Document | |
| Kearse Betty Ann | -- | None Listed On Document | |
| Kearse Betty Ann | -- | None Listed On Document | |
| Kearse Betty Ann | -- | None Available | |
| Davis Violet | -- | None Available | |
| Kearse Matthew | -- | -- |
Source: Public Records
Tax History Compared to Growth
Tax History
| Year | Tax Paid | Tax Assessment Tax Assessment Total Assessment is a certain percentage of the fair market value that is determined by local assessors to be the total taxable value of land and additions on the property. | Land | Improvement |
|---|---|---|---|---|
| 2024 | $959 | $2,990 | $580 | $2,410 |
| 2023 | $228 | $2,990 | $580 | $2,410 |
| 2022 | $79 | $2,140 | $470 | $1,670 |
| 2021 | $153 | $2,140 | $470 | $1,670 |
| 2020 | $235 | $1,860 | $410 | $1,450 |
| 2019 | $233 | $1,860 | $410 | $1,450 |
| 2018 | $418 | $1,860 | $410 | $1,450 |
| 2017 | $413 | $1,860 | $410 | $1,450 |
| 2016 | $26 | $46,560 | $10,260 | $36,300 |
| 2015 | $36 | $46,560 | $10,260 | $36,300 |
| 2014 | $36 | $40,509 | $8,936 | $31,573 |
Source: Public Records
Map
Nearby Homes
- 101 E Main St
- 221 Wood River Way
- Teton Plan at Freeman Park
- 117 Selton Place Unit FP 24 Teton B
- 113 Selton Place Unit FP 22 Teton A1E
- 120 Selton Place Unit FP 31 Teton B
- 122 Stephenson Street Extension
- 16 Stone Mill Ct
- 406 Crescentwood Ct
- 109 Twinflower Dr
- 705 Hayden Ct
- 1 Longmeadow Rd
- 5 Nova St
- 2 Hillbrook Rd
- 6 Gavin Place
- 107 Selton Place Unit FP 19 Teton B
- 122 Selton Place Unit FP 30 Teton B
- 121 Selton Place Unit FP 26 Teton A1E
- 125 Selton Place
- 123 Selton Place Unit FP 27 Teton B
- 22 Riverside Dr
- 19 Riverside Dr
- 10 Riverside Dr
- 100 Riverside Dr
- 103 Riverside Dr
- 102 Riverside Dr
- 107 Riverside Dr
- 110 Aiken Dos Ln
- 102 Aiken Chapel Rd
- 100 Aiken Chapel Rd
- 109 Riverside Dr
- 100 Aiken Dos Ln
- 6 Beeks Rd
- 105 Aiken Dos Ln
- 0 Aiken Chapel Rd Unit 1344511
- 0 Aiken Chapel Rd Unit 1368140
- 161 Riverside Dr
- 6 Aiken Uno Ln
- 165 Riverside Dr
- 10 Aiken Uno Ln