Estimated Value: $71,863 - $109,000
--
Bed
1
Bath
914
Sq Ft
$107/Sq Ft
Est. Value
About This Home
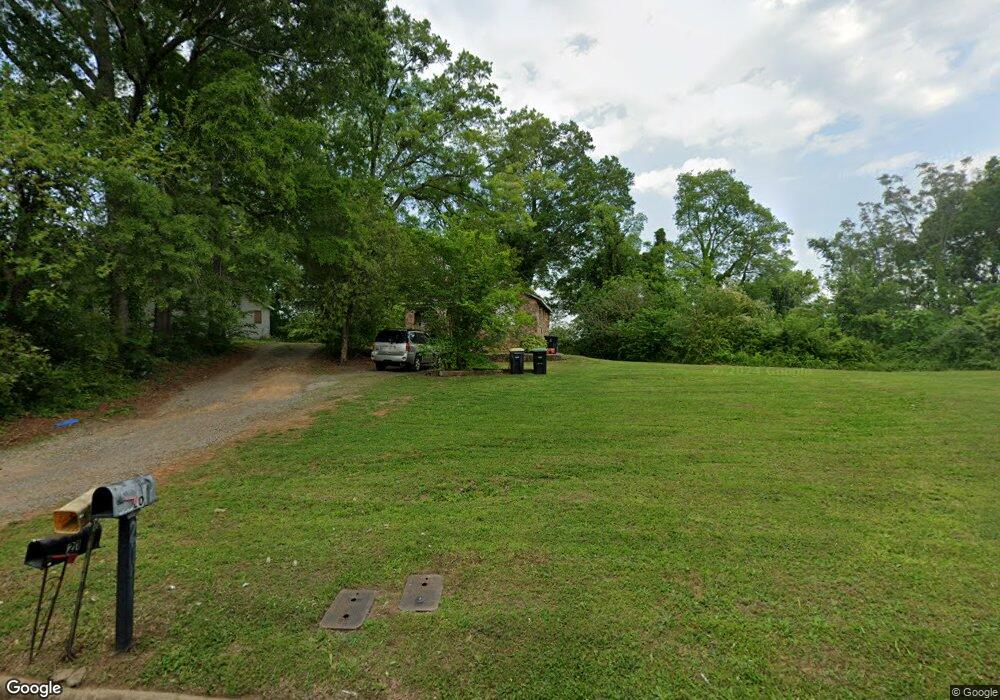
This home is located at 20 Ross St NE, Rome, GA 30161 and is currently estimated at $98,216, approximately $107 per square foot. 20 Ross St NE is a home located in Floyd County with nearby schools including Rome High School, St. Mary School, and Unity Christian School.
Ownership History
Date
Name
Owned For
Owner Type
Purchase Details
Closed on
Sep 15, 2021
Sold by
Ttg Rentals Llc
Bought by
Just Properties Llc
Current Estimated Value
Purchase Details
Closed on
Aug 12, 2005
Sold by
Youngblood E B
Bought by
Property Acquisitions Of Georg
Purchase Details
Closed on
Nov 27, 2001
Sold by
Cochran Danny L
Bought by
Youngblood E B
Purchase Details
Closed on
Jan 3, 1992
Sold by
Bearden Charles F
Bought by
Cochran S E
Purchase Details
Closed on
Jun 18, 1984
Sold by
Powers Nicholas D
Bought by
Bearden Charles F
Purchase Details
Closed on
May 13, 1983
Sold by
Williams Eugenia H
Bought by
Powers Nicholas D
Purchase Details
Closed on
Feb 29, 1980
Sold by
Williams Evelyn and Williams Stephen
Bought by
Williams Eugenia H
Purchase Details
Closed on
Jan 2, 1901
Sold by
Williams Julian
Bought by
Williams Evelyn and Williams Stephen
Purchase Details
Closed on
Jan 1, 1901
Bought by
Williams Julian
Create a Home Valuation Report for This Property
The Home Valuation Report is an in-depth analysis detailing your home's value as well as a comparison with similar homes in the area
Home Values in the Area
Average Home Value in this Area
Purchase History
| Date | Buyer | Sale Price | Title Company |
|---|---|---|---|
| Just Properties Llc | $10,000 | -- | |
| Property Acquisitions Of Georg | $20,000 | -- | |
| Youngblood E B | $3,500 | -- | |
| Cochran Danny L | -- | -- | |
| Cochran S E | $5,000 | -- | |
| Bearden Charles F | $5,000 | -- | |
| Powers Nicholas D | $3,000 | -- | |
| Williams Eugenia H | -- | -- | |
| Williams Evelyn | -- | -- | |
| Williams Julian | -- | -- |
Source: Public Records
Tax History Compared to Growth
Tax History
| Year | Tax Paid | Tax Assessment Tax Assessment Total Assessment is a certain percentage of the fair market value that is determined by local assessors to be the total taxable value of land and additions on the property. | Land | Improvement |
|---|---|---|---|---|
| 2024 | $864 | $22,038 | $8,531 | $13,507 |
| 2023 | $780 | $20,387 | $7,528 | $12,859 |
| 2022 | $470 | $12,886 | $6,022 | $6,864 |
| 2021 | $307 | $8,272 | $2,938 | $5,334 |
| 2020 | $268 | $7,162 | $2,203 | $4,959 |
| 2019 | $251 | $6,778 | $2,203 | $4,575 |
| 2018 | $235 | $6,352 | $2,203 | $4,149 |
| 2017 | $227 | $6,131 | $2,203 | $3,928 |
| 2016 | $221 | $5,960 | $2,200 | $3,760 |
| 2015 | $290 | $5,978 | $2,200 | $3,778 |
| 2014 | $290 | $8,258 | $4,480 | $3,778 |
Source: Public Records
Map
Nearby Homes
- 110 Smith St NE
- 102 Smith St NE
- 13 Heard St NE
- 15 Heard St
- 1208 N Broad St NE
- 31 Ross St NE
- 106 Ross St NE
- 303 Grady Ave NE
- 163 Sweet Water Lane Dr SE
- 138 E 8th Ave Unit 25
- 117 Jackson St NE
- 119 Jackson St NE
- 3 Forsyth St NE
- 1 Wright St NE
- 0 Washington Dr SE Unit 10660409
- 325 Ross St NE
- 29 Pear St
- 3 Roseway Cir NE
- 407 E 3rd St
- 311 Chambers St NE
- 24 Ross St NE
- 21 Ross St NE
- 21 Ross St NE
- 26 Ross St NE
- 26 Ross St NE
- 1021 N Broad St NE
- 19 Ross St NE
- 25 Ross St NE
- 1019 N Broad St NE
- 1019 N Broad St NE Unit A
- 12 Ross St NE
- 30 Ross St NE
- 106 Smith St NE
- 106 Smith St NE
- 1027 N Broad St NE
- 15 Ross St NE
- 116 Smith St NE
- 32 Ross St NE
- 0 Heard St NE Unit 7117707
- 0 Heard St NE Unit 10093522