20 Royce Rd Framingham, MA 01701
Estimated Value: $507,000 - $609,842
About This Home
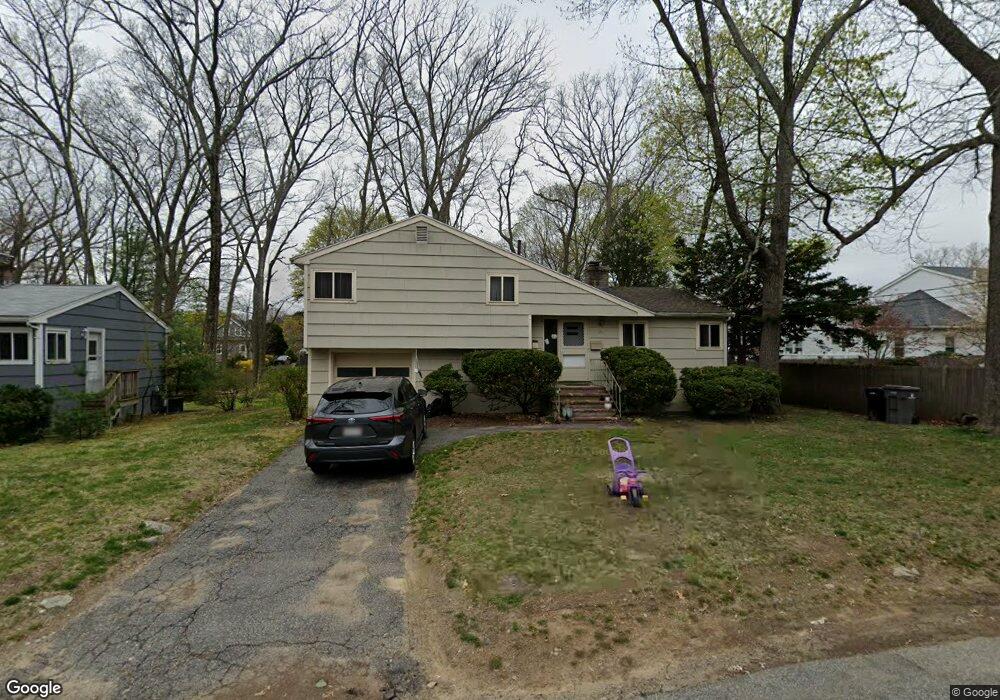
This home is located at 20 Royce Rd, Framingham, MA 01701 and is currently estimated at $578,461, approximately $474 per square foot. 20 Royce Rd is a home located in Middlesex County with nearby schools including Framingham High School, Christa McAuliffe Charter School, and Happy Hollow School.
Ownership History
We collect this data history from publicly available records. To have your information removed, we recommend requesting removal directly through your county’s website.
Purchase Details
Purchase Details
Purchase Details
Home Values in the Area
Average Home Value in this Area
Purchase History
We collect this data history from publicly available records. To have your information removed, we recommend requesting removal directly through your county’s website.
| Date | Buyer | Sale Price | Title Company |
|---|---|---|---|
| -- | None Available | ||
| -- | None Available | ||
| -- | None Available | ||
| -- | None Available | ||
| -- | -- |
Tax History
We collect this data history from publicly available records. To have your information removed, we recommend requesting removal directly through your county’s website.
| Year | Tax Paid | Tax Assessment Tax Assessment Total Assessment is a certain percentage of the fair market value that is determined by local assessors to be the total taxable value of land and additions on the property. | Land | Improvement |
|---|---|---|---|---|
| 2025 | $6,497 | $544,100 | $261,000 | $283,100 |
| 2024 | $6,163 | $494,600 | $233,100 | $261,500 |
| 2023 | $5,795 | $442,700 | $208,000 | $234,700 |
| 2022 | $5,460 | $397,400 | $188,800 | $208,600 |
| 2021 | $5,346 | $380,500 | $181,500 | $199,000 |
| 2020 | $5,354 | $357,400 | $164,900 | $192,500 |
| 2019 | $5,298 | $344,500 | $164,900 | $179,600 |
| 2018 | $5,218 | $319,700 | $158,700 | $161,000 |
| 2017 | $5,071 | $303,500 | $154,100 | $149,400 |
| 2016 | $4,922 | $283,200 | $154,100 | $129,100 |
| 2015 | $4,769 | $267,600 | $154,300 | $113,300 |
Map
- 6 Royce Rd
- 212 Beacon St
- 19 Ruth Dr
- 11 Ruth Dr
- 22 Leonard Rd
- 109 Hastings St
- 46 Cochituate Rd Unit 203
- 46 Cochituate Rd Unit 106
- 5 Summer Ln
- 5 Antrim Rd
- 7 Ballydrain Rd
- 164 Lockland Ave
- 8 Sunset Dr
- 28 Valentine Rd
- 27 Randy Rd
- 61 Indian Head Rd
- 419 Old Connecticut Path
- 331 Prospect St
- 12 Lilian Rd
- 66 Perry Henderson Dr
Ask me questions while you tour the home.