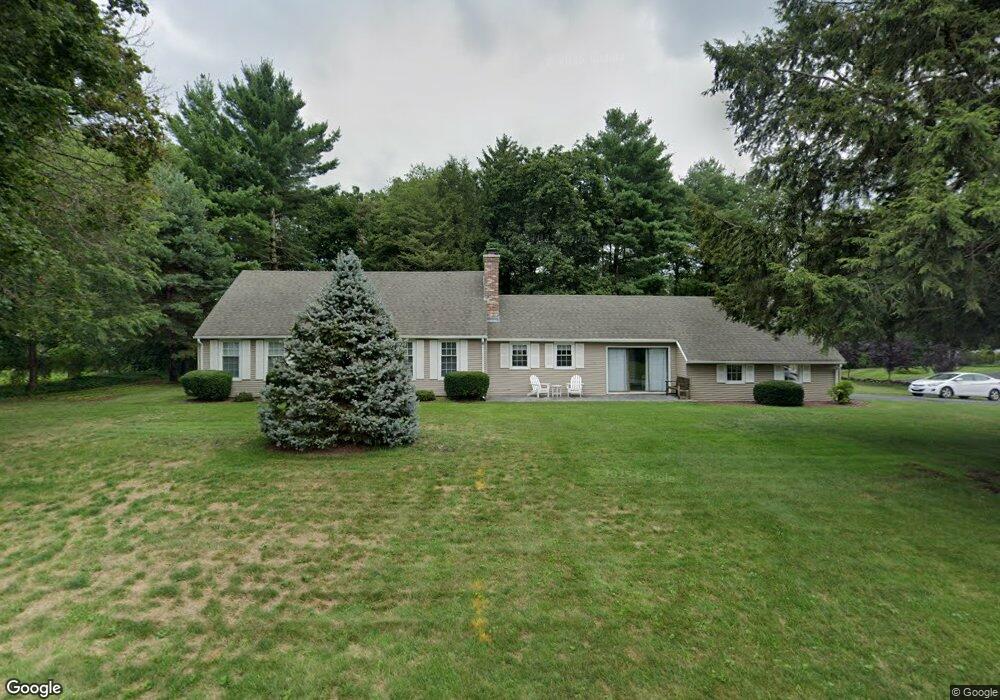
20 Scenic Dr Wilbraham, MA 01095
Estimated Value: $458,392 - $565,000
4
Beds
2
Baths
1,760
Sq Ft
$290/Sq Ft
Est. Value
About This Home
This home is located at 20 Scenic Dr, Wilbraham, MA 01095 and is currently estimated at $510,098, approximately $289 per square foot. 20 Scenic Dr is a home located in Hampden County with nearby schools including Minnechaug Regional High School, Pioneer Valley Montessori School, and Wilbraham & Monson Academy.
Ownership History
Date
Name
Owned For
Owner Type
Purchase Details
Closed on
Nov 12, 2010
Sold by
Petzold Marilyn P
Bought by
Ranck Edward C and Ranck Robin A
Current Estimated Value
Home Financials for this Owner
Home Financials are based on the most recent Mortgage that was taken out on this home.
Original Mortgage
$200,000
Outstanding Balance
$131,979
Interest Rate
4.35%
Mortgage Type
Purchase Money Mortgage
Estimated Equity
$378,119
Create a Home Valuation Report for This Property
The Home Valuation Report is an in-depth analysis detailing your home's value as well as a comparison with similar homes in the area
Home Values in the Area
Average Home Value in this Area
Purchase History
| Date | Buyer | Sale Price | Title Company |
|---|---|---|---|
| Ranck Edward C | $256,000 | -- |
Source: Public Records
Mortgage History
| Date | Status | Borrower | Loan Amount |
|---|---|---|---|
| Open | Ranck Edward C | $200,000 |
Source: Public Records
Tax History Compared to Growth
Tax History
| Year | Tax Paid | Tax Assessment Tax Assessment Total Assessment is a certain percentage of the fair market value that is determined by local assessors to be the total taxable value of land and additions on the property. | Land | Improvement |
|---|---|---|---|---|
| 2025 | $6,821 | $381,500 | $103,900 | $277,600 |
| 2024 | $6,203 | $335,300 | $103,900 | $231,400 |
| 2023 | $5,941 | $317,700 | $103,900 | $213,800 |
| 2022 | $6,163 | $300,800 | $103,900 | $196,900 |
| 2021 | $5,864 | $255,400 | $110,600 | $144,800 |
| 2020 | $5,716 | $255,400 | $110,600 | $144,800 |
| 2019 | $5,568 | $255,400 | $110,600 | $144,800 |
| 2018 | $5,409 | $238,900 | $110,600 | $128,300 |
| 2017 | $5,256 | $238,900 | $110,600 | $128,300 |
| 2016 | $5,210 | $241,200 | $122,700 | $118,500 |
| 2015 | $5,036 | $241,200 | $122,700 | $118,500 |
Source: Public Records
Map
Nearby Homes
- 6 Katie St
- 1028 Tinkham Rd
- 390 Soule Rd
- 460 Soule Rd
- 767 Stony Hill Rd
- 59 Baldwin Dr
- 760 Stony Hill Rd
- 763 Stony Hill Rd
- 374
- 230V Burleigh Rd
- 14 Brookdale Dr
- 27 Eastwood Dr
- 19 Forest Hill Rd
- 5 Edgewood Rd
- 68 Monson Rd
- 500 Springfield St
- 25 Angelica Dr
- 85 Brookhaven Dr
- 98 Brookhaven Dr
- 331 Grand Valley Rd