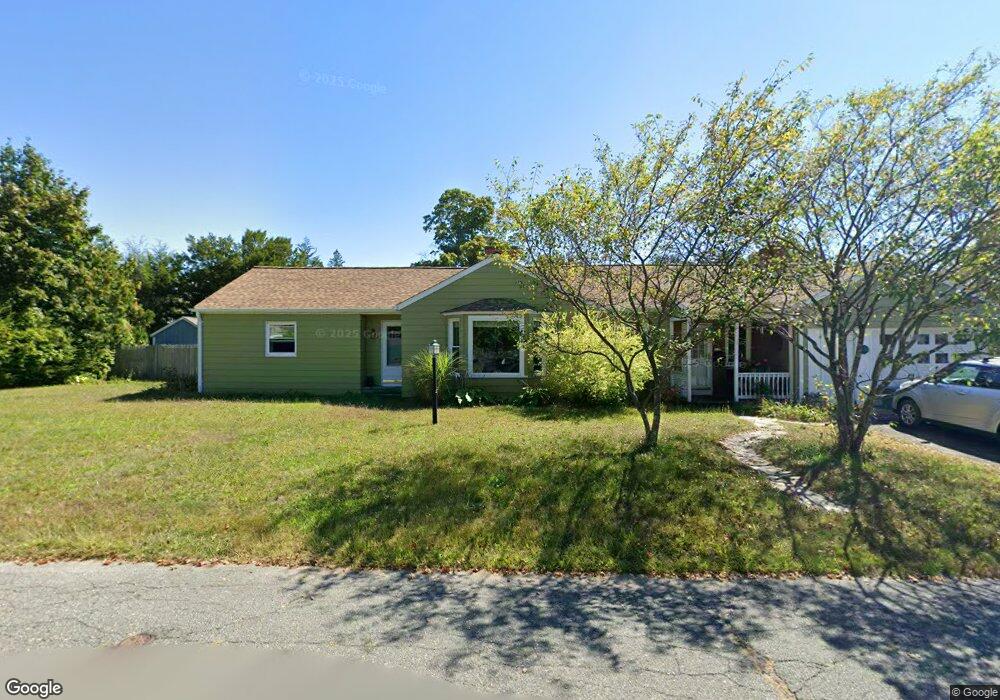
20 Sheldon Ave Easthampton, MA 01027
Estimated Value: $493,000 - $510,000
3
Beds
2
Baths
1,906
Sq Ft
$264/Sq Ft
Est. Value
About This Home
This home is located at 20 Sheldon Ave, Easthampton, MA 01027 and is currently estimated at $504,060, approximately $264 per square foot. 20 Sheldon Ave is a home located in Hampshire County with nearby schools including Easthampton High School, Hilltown Cooperative Charter Public School, and Calvary Baptist Christian School.
Ownership History
Date
Name
Owned For
Owner Type
Purchase Details
Closed on
Jan 23, 2007
Sold by
Nemeroff Steven
Bought by
Rea Mark S and Gambarini Patricia L
Current Estimated Value
Purchase Details
Closed on
Apr 30, 2003
Sold by
Symonds G James and Hill Robert L
Bought by
Nemeroff Steven
Home Financials for this Owner
Home Financials are based on the most recent Mortgage that was taken out on this home.
Original Mortgage
$173,250
Interest Rate
5.82%
Mortgage Type
Purchase Money Mortgage
Purchase Details
Closed on
Oct 15, 1996
Sold by
Migliozzi Louis P
Bought by
Symonds James G
Home Financials for this Owner
Home Financials are based on the most recent Mortgage that was taken out on this home.
Original Mortgage
$100,800
Interest Rate
8.06%
Mortgage Type
Purchase Money Mortgage
Create a Home Valuation Report for This Property
The Home Valuation Report is an in-depth analysis detailing your home's value as well as a comparison with similar homes in the area
Home Values in the Area
Average Home Value in this Area
Purchase History
| Date | Buyer | Sale Price | Title Company |
|---|---|---|---|
| Rea Mark S | $272,500 | -- | |
| Nemeroff Steven | $192,500 | -- | |
| Symonds James G | $112,000 | -- |
Source: Public Records
Mortgage History
| Date | Status | Borrower | Loan Amount |
|---|---|---|---|
| Previous Owner | Symonds James G | $173,250 | |
| Previous Owner | Symonds James G | $45,761 | |
| Previous Owner | Symonds James G | $30,000 | |
| Previous Owner | Symonds James G | $100,800 |
Source: Public Records
Tax History
| Year | Tax Paid | Tax Assessment Tax Assessment Total Assessment is a certain percentage of the fair market value that is determined by local assessors to be the total taxable value of land and additions on the property. | Land | Improvement |
|---|---|---|---|---|
| 2025 | $5,998 | $438,800 | $121,500 | $317,300 |
| 2024 | $5,797 | $427,500 | $118,200 | $309,300 |
| 2023 | $4,370 | $298,300 | $93,300 | $205,000 |
| 2022 | $4,931 | $298,300 | $93,300 | $205,000 |
| 2021 | $5,408 | $308,300 | $93,300 | $215,000 |
| 2020 | $5,298 | $298,300 | $93,300 | $205,000 |
| 2019 | $4,425 | $286,200 | $93,300 | $192,900 |
| 2018 | $4,242 | $265,100 | $88,200 | $176,900 |
| 2017 | $4,143 | $255,600 | $84,700 | $170,900 |
| 2016 | $4,152 | $266,300 | $84,700 | $181,600 |
| 2015 | $4,034 | $266,300 | $84,700 | $181,600 |
Source: Public Records
Map
Nearby Homes
- 385 Main St
- 336 Main St
- 6 Wilton Rd
- M143 &152 Glendale St
- 131 West St Unit 131
- 6 S St & Abutting Lots
- 26 Winter St
- 2 W Park Dr
- 19 Nicols Way Unit 19
- 7 Union Ct
- 11 Dragon Cir
- 4 Gaugh St
- 38 College Hwy
- 36 & 36R Holly Cir
- 33 Knipfer Ave
- Lot 3R Pomeroy Meadow Rd
- 40 Clark St
- 2 Oak St
- 12 Golden Cir
- 4 Laurel Dr
Your Personal Tour Guide
Ask me questions while you tour the home.