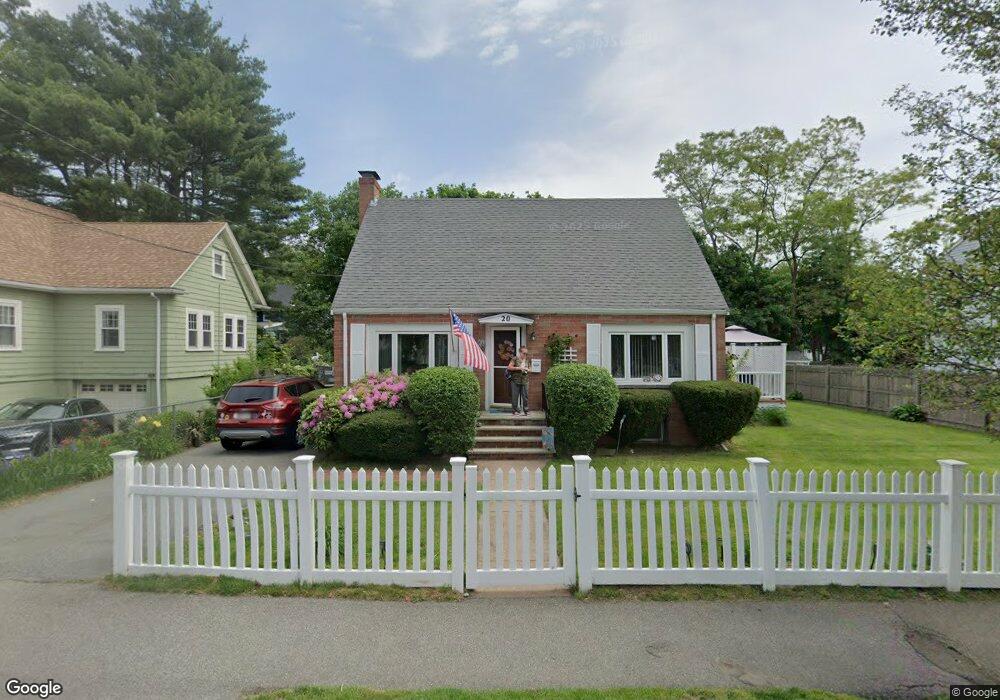
20 Sherman Rd Dedham, MA 02026
The Manor NeighborhoodEstimated Value: $611,000 - $675,000
2
Beds
1
Bath
1,267
Sq Ft
$504/Sq Ft
Est. Value
About This Home
This home is located at 20 Sherman Rd, Dedham, MA 02026 and is currently estimated at $638,300, approximately $503 per square foot. 20 Sherman Rd is a home located in Norfolk County with nearby schools including Greenlodge Elementary School, Dedham Middle School, and Dedham High School.
Ownership History
Date
Name
Owned For
Owner Type
Purchase Details
Closed on
Jun 30, 2000
Sold by
Askins Michael J and Askins Sylvie V
Bought by
Mcdevitt Eamon
Current Estimated Value
Home Financials for this Owner
Home Financials are based on the most recent Mortgage that was taken out on this home.
Original Mortgage
$204,750
Interest Rate
8.59%
Mortgage Type
Purchase Money Mortgage
Purchase Details
Closed on
Nov 10, 1995
Sold by
Katelyn Homes Inc and Askins M J
Bought by
Askins Michael J and Askins Sylvie
Purchase Details
Closed on
Sep 14, 1995
Sold by
Katelyn Homes Inc
Bought by
Maher James and Maher Kathleen J
Purchase Details
Closed on
Jul 11, 1995
Sold by
Yaroszewski Katie
Bought by
Katelyn Homes Inc
Create a Home Valuation Report for This Property
The Home Valuation Report is an in-depth analysis detailing your home's value as well as a comparison with similar homes in the area
Home Values in the Area
Average Home Value in this Area
Purchase History
| Date | Buyer | Sale Price | Title Company |
|---|---|---|---|
| Mcdevitt Eamon | $227,500 | -- | |
| Askins Michael J | $140,000 | -- | |
| Maher James | $155,900 | -- | |
| Katelyn Homes Inc | $140,000 | -- |
Source: Public Records
Mortgage History
| Date | Status | Borrower | Loan Amount |
|---|---|---|---|
| Open | Katelyn Homes Inc | $197,000 | |
| Closed | Katelyn Homes Inc | $92,000 | |
| Closed | Katelyn Homes Inc | $204,750 |
Source: Public Records
Tax History
| Year | Tax Paid | Tax Assessment Tax Assessment Total Assessment is a certain percentage of the fair market value that is determined by local assessors to be the total taxable value of land and additions on the property. | Land | Improvement |
|---|---|---|---|---|
| 2025 | $7,599 | $602,100 | $332,900 | $269,200 |
| 2024 | $7,411 | $592,900 | $302,000 | $290,900 |
| 2023 | $6,985 | $544,000 | $273,500 | $270,500 |
| 2022 | $6,582 | $493,000 | $256,800 | $236,200 |
| 2021 | $6,022 | $440,500 | $237,800 | $202,700 |
| 2020 | $6,236 | $454,500 | $237,800 | $216,700 |
| 2019 | $5,785 | $408,800 | $206,800 | $202,000 |
| 2018 | $5,497 | $377,800 | $181,500 | $196,300 |
| 2017 | $5,408 | $366,400 | $170,100 | $196,300 |
| 2016 | $5,254 | $339,200 | $157,500 | $181,700 |
| 2015 | $4,959 | $312,500 | $154,800 | $157,700 |
| 2014 | $4,810 | $299,100 | $152,000 | $147,100 |
Source: Public Records
Map
Nearby Homes
- 397 Sprague St
- 391 Sprague St
- 2 Leominster Rd
- 51 Lancaster Rd
- 86 Durham Rd
- 94 Durham Rd
- 18 Greensboro Rd
- 72 Crane St
- 93 Alden St
- 68 Reed St
- 22 Azalea Cir
- 24 Prescott St Unit 3
- 24 Prescott St Unit 1
- 13 W Milton Place
- 45 Como Rd
- 15 Yuill Cir Unit 2
- 000 Danny Rd
- 241 Neponset Valley Pkwy Unit 241
- 50 Sprague St
- 12 Blossom St
Your Personal Tour Guide
Ask me questions while you tour the home.