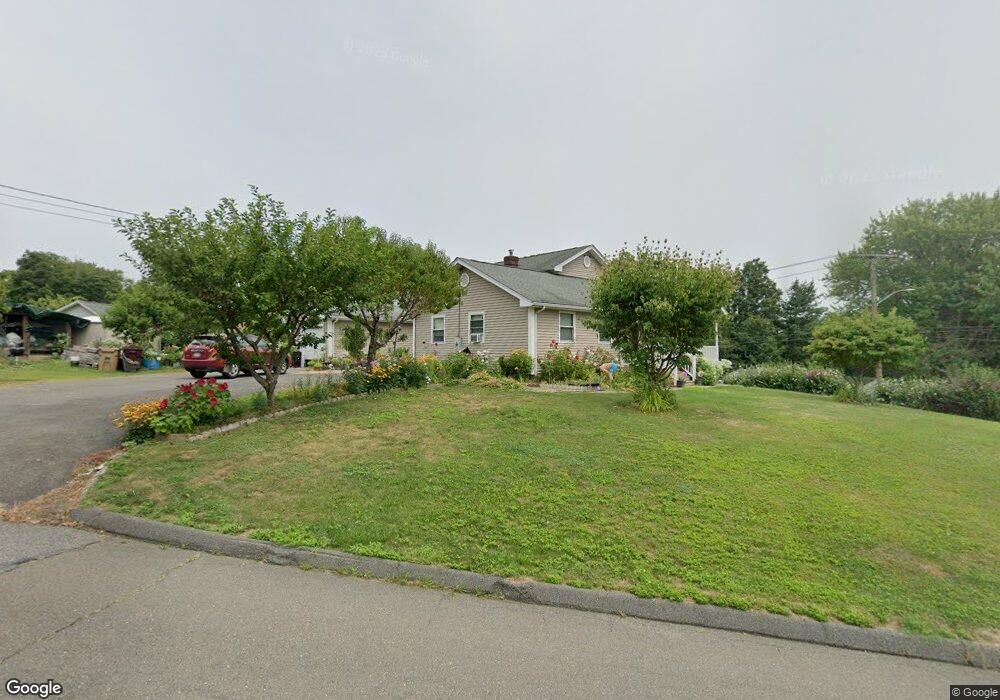
20 Skyridge St Ludlow, MA 01056
Estimated Value: $289,000 - $297,000
3
Beds
2
Baths
864
Sq Ft
$339/Sq Ft
Est. Value
About This Home
This home is located at 20 Skyridge St, Ludlow, MA 01056 and is currently estimated at $292,572, approximately $338 per square foot. 20 Skyridge St is a home located in Hampden County with nearby schools including East Street Elementary School, Chapin Street Elementary School, and Paul R. Baird Middle School.
Ownership History
Date
Name
Owned For
Owner Type
Purchase Details
Closed on
Sep 30, 2015
Sold by
Pinto Joao M and Almeida Maria E
Bought by
Ferreira Patricia P and Pinto Jorge M
Current Estimated Value
Purchase Details
Closed on
Mar 28, 2003
Sold by
Mccarthy Patrick J
Bought by
Pinto Joao Manuel P and Almeida Maria E
Home Financials for this Owner
Home Financials are based on the most recent Mortgage that was taken out on this home.
Original Mortgage
$99,200
Interest Rate
5.91%
Mortgage Type
Purchase Money Mortgage
Create a Home Valuation Report for This Property
The Home Valuation Report is an in-depth analysis detailing your home's value as well as a comparison with similar homes in the area
Home Values in the Area
Average Home Value in this Area
Purchase History
| Date | Buyer | Sale Price | Title Company |
|---|---|---|---|
| Ferreira Patricia P | -- | -- | |
| Ferreira Patricia P | -- | -- | |
| Pinto Joao Manuel P | $124,000 | -- | |
| Pinto Joao Manuel P | $124,000 | -- |
Source: Public Records
Mortgage History
| Date | Status | Borrower | Loan Amount |
|---|---|---|---|
| Previous Owner | Pinto Joao Manuel P | $21,500 | |
| Previous Owner | Pinto Joao Manuel P | $99,200 |
Source: Public Records
Tax History
| Year | Tax Paid | Tax Assessment Tax Assessment Total Assessment is a certain percentage of the fair market value that is determined by local assessors to be the total taxable value of land and additions on the property. | Land | Improvement |
|---|---|---|---|---|
| 2025 | $4,273 | $246,300 | $88,100 | $158,200 |
| 2024 | $4,125 | $228,000 | $87,900 | $140,100 |
| 2023 | $3,961 | $203,000 | $80,500 | $122,500 |
| 2022 | $3,580 | $179,100 | $73,800 | $105,300 |
| 2021 | $3,615 | $171,500 | $73,800 | $97,700 |
| 2020 | $3,466 | $168,100 | $72,700 | $95,400 |
| 2019 | $3,229 | $162,900 | $72,000 | $90,900 |
| 2018 | $3,038 | $159,800 | $72,000 | $87,800 |
| 2017 | $2,918 | $157,500 | $70,500 | $87,000 |
| 2016 | $2,834 | $156,300 | $69,100 | $87,200 |
| 2015 | $2,685 | $155,300 | $68,400 | $86,900 |
Source: Public Records
Map
Nearby Homes
- 47 Kendall St
- 382 Holyoke St
- 482 Holyoke St
- 350 West St Unit 3
- 350 West St Unit 19
- 350 West St Unit 17
- Lot 602 Grandview Ave
- 15 Hilltop Terrace
- 42 Roy St
- 57 Belmont St
- 119 Blisswood Village Dr
- 102 Swan Ave
- 42 Loopley St
- 70 Fuller St
- 26 Swan Ave
- 0 Fuller St Unit 73409741
- 12 Mariana Way
- '0' Rood St
- 84 Chapin Greene Dr
- 59 Prospect Gardens
Your Personal Tour Guide
Ask me questions while you tour the home.