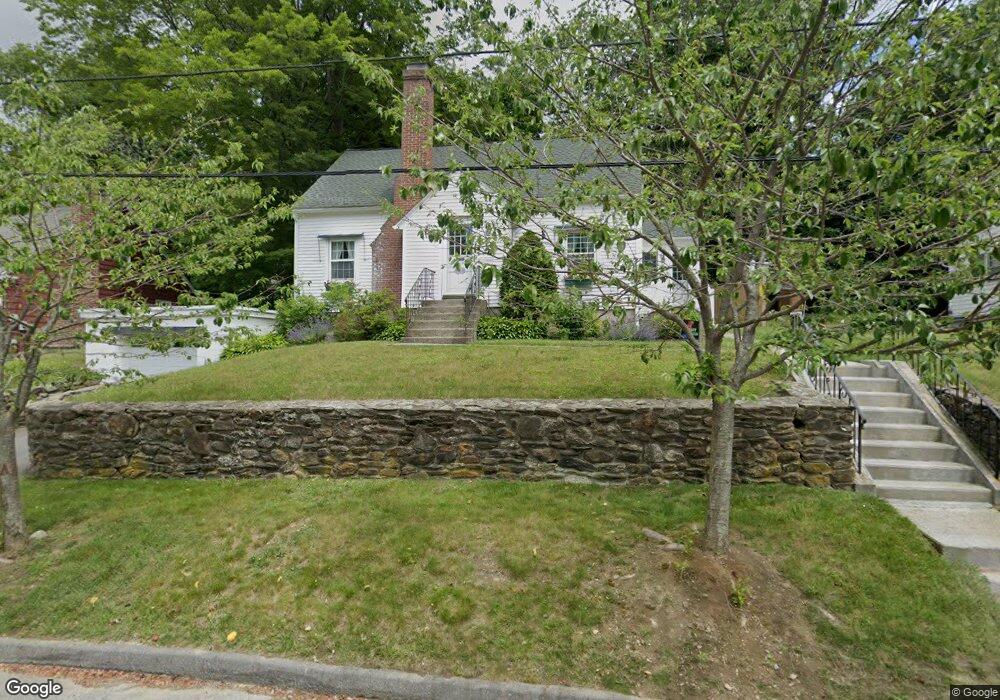
20 Sorrento St Worcester, MA 01602
West Tatnuck NeighborhoodEstimated Value: $424,000 - $472,000
3
Beds
2
Baths
1,260
Sq Ft
$354/Sq Ft
Est. Value
About This Home
This home is located at 20 Sorrento St, Worcester, MA 01602 and is currently estimated at $445,794, approximately $353 per square foot. 20 Sorrento St is a home located in Worcester County with nearby schools including Tatnuck Magnet School, Chandler Magnet, and Jacob Hiatt Magnet School.
Ownership History
Date
Name
Owned For
Owner Type
Purchase Details
Closed on
Jan 30, 1992
Sold by
Cotton Robert K and Cotton Catherine
Bought by
Kimball Michael T and Hunt Joyce E
Current Estimated Value
Home Financials for this Owner
Home Financials are based on the most recent Mortgage that was taken out on this home.
Original Mortgage
$110,200
Interest Rate
8.44%
Mortgage Type
Purchase Money Mortgage
Create a Home Valuation Report for This Property
The Home Valuation Report is an in-depth analysis detailing your home's value as well as a comparison with similar homes in the area
Home Values in the Area
Average Home Value in this Area
Purchase History
| Date | Buyer | Sale Price | Title Company |
|---|---|---|---|
| Kimball Michael T | $116,000 | -- |
Source: Public Records
Mortgage History
| Date | Status | Borrower | Loan Amount |
|---|---|---|---|
| Open | Kimball Michael T | $9,500 | |
| Closed | Kimball Michael T | $110,200 | |
| Previous Owner | Kimball Michael T | $20,000 | |
| Previous Owner | Kimball Michael T | $63,000 |
Source: Public Records
Tax History Compared to Growth
Tax History
| Year | Tax Paid | Tax Assessment Tax Assessment Total Assessment is a certain percentage of the fair market value that is determined by local assessors to be the total taxable value of land and additions on the property. | Land | Improvement |
|---|---|---|---|---|
| 2025 | $4,851 | $367,800 | $117,700 | $250,100 |
| 2024 | $4,762 | $346,300 | $117,700 | $228,600 |
| 2023 | $4,564 | $318,300 | $102,400 | $215,900 |
| 2022 | $4,181 | $274,900 | $81,900 | $193,000 |
| 2021 | $3,972 | $244,000 | $65,500 | $178,500 |
| 2020 | $3,951 | $232,400 | $65,500 | $166,900 |
| 2019 | $3,758 | $208,800 | $58,900 | $149,900 |
| 2018 | $3,773 | $199,500 | $58,900 | $140,600 |
| 2017 | $3,613 | $188,000 | $58,900 | $129,100 |
| 2016 | $3,547 | $172,100 | $42,900 | $129,200 |
| 2015 | $3,454 | $172,100 | $42,900 | $129,200 |
| 2014 | $3,363 | $172,100 | $42,900 | $129,200 |
Source: Public Records
Map
Nearby Homes
- 12 Copperfield Rd
- 806 Pleasant St
- 1029 Pleasant St Unit 19
- 12 Merlin Ct
- 40 Rustic Dr
- 40 Walter St
- 28 Cascade Rd
- 9 Newburn Rd
- 20 Manhattan Rd
- 980 Pleasant St
- 148A Tory Fort Ln
- 563 Chandler St
- 3 Jenkins St
- 155 Tory Fort Ln
- 5 Forest Hill Dr
- 17 Orrison St
- 47R Yarnie Unit 3B
- 47R Yarnie Unit 3A
- 47R Yarnie Unit 1B
- 47R Yarnie Unit 2B