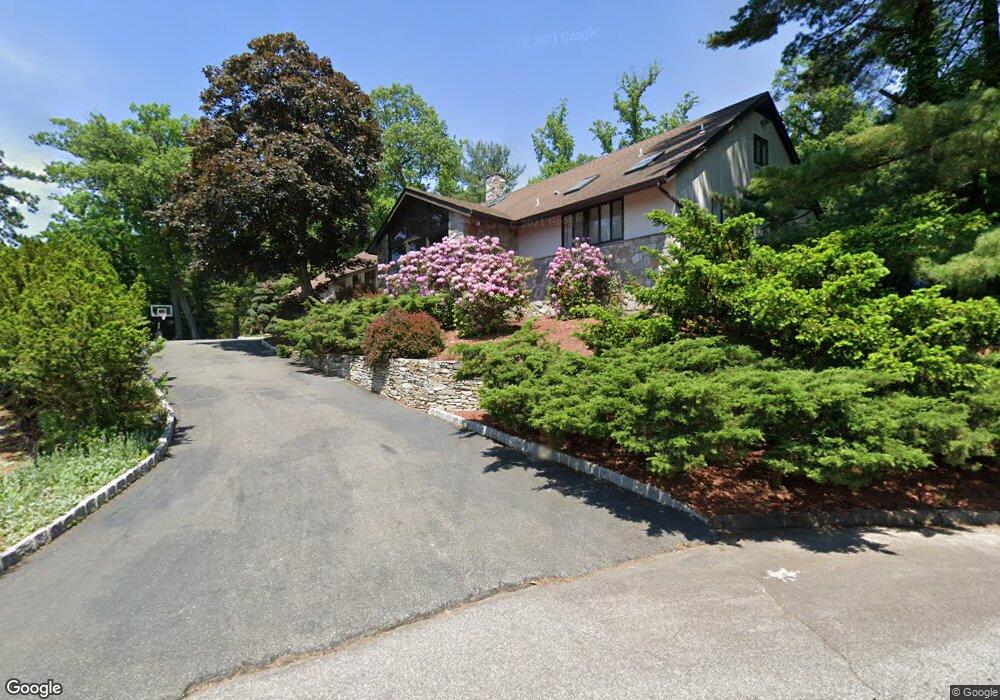
20 Stanton Rd Unit House Tenafly, NJ 07670
Estimated Value: $2,794,095 - $4,575,000
6
Beds
6
Baths
6,323
Sq Ft
$533/Sq Ft
Est. Value
About This Home
This home is located at 20 Stanton Rd Unit House, Tenafly, NJ 07670 and is currently estimated at $3,369,024, approximately $532 per square foot. 20 Stanton Rd Unit House is a home located in Bergen County with nearby schools including Tenafly Middle School, Tenafly High School, and Spring School.
Ownership History
Date
Name
Owned For
Owner Type
Purchase Details
Closed on
Sep 29, 2000
Bought by
Fini Mario
Current Estimated Value
Home Financials for this Owner
Home Financials are based on the most recent Mortgage that was taken out on this home.
Original Mortgage
$282,500
Outstanding Balance
$103,172
Interest Rate
7.94%
Estimated Equity
$3,265,852
Purchase Details
Closed on
Dec 30, 1998
Sold by
Alaska Seaboard Partners
Bought by
Fini Mario and Fini Dian
Home Financials for this Owner
Home Financials are based on the most recent Mortgage that was taken out on this home.
Original Mortgage
$531,250
Interest Rate
6.87%
Create a Home Valuation Report for This Property
The Home Valuation Report is an in-depth analysis detailing your home's value as well as a comparison with similar homes in the area
Home Values in the Area
Average Home Value in this Area
Purchase History
| Date | Buyer | Sale Price | Title Company |
|---|---|---|---|
| Fini Mario | -- | -- | |
| Fini Mario | -- | -- | |
| Fini Mario | $675,000 | -- |
Source: Public Records
Mortgage History
| Date | Status | Borrower | Loan Amount |
|---|---|---|---|
| Open | Fini Mario | $282,500 | |
| Closed | Fini Mario | $282,500 | |
| Previous Owner | Fini Mario | $531,250 |
Source: Public Records
Tax History Compared to Growth
Tax History
| Year | Tax Paid | Tax Assessment Tax Assessment Total Assessment is a certain percentage of the fair market value that is determined by local assessors to be the total taxable value of land and additions on the property. | Land | Improvement |
|---|---|---|---|---|
| 2025 | $38,354 | $1,350,000 | $1,094,000 | $256,000 |
| 2024 | $37,422 | $1,350,000 | $1,094,000 | $256,000 |
| 2023 | $36,518 | $1,350,000 | $1,094,000 | $256,000 |
| 2022 | $36,518 | $1,350,000 | $1,094,000 | $256,000 |
| 2021 | $35,870 | $1,350,000 | $1,094,000 | $256,000 |
| 2020 | $49,093 | $1,875,200 | $1,094,000 | $781,200 |
| 2019 | $48,230 | $1,875,200 | $1,094,000 | $781,200 |
| 2018 | $47,480 | $1,875,200 | $1,094,000 | $781,200 |
| 2017 | $47,311 | $1,875,200 | $1,094,000 | $781,200 |
| 2016 | $46,374 | $1,875,200 | $1,094,000 | $781,200 |
| 2015 | $45,342 | $1,875,200 | $1,094,000 | $781,200 |
| 2014 | $44,499 | $1,875,200 | $1,094,000 | $781,200 |
Source: Public Records
Map
Nearby Homes
- 8 Stanton Rd
- 2 N Brae Ct
- 5 Leslie Place
- 91 Tekening Dr
- 196 Vaccaro Dr
- 67 Forest Rd
- 84 Depeyster Ave
- 79 Berkeley Dr
- 117 Truman Dr
- 55 Ridge Rd
- 22 Old Smith Rd
- 118 Hoover Dr
- 366 E Madison Ave
- 4 Depeyster Ave
- 109 Stonehurst Dr
- 16 Loman Ct
- 10 Orchard Place
- 136 Stonehurst Dr
- 31 Rio Vista Dr
- 23 Rio Vista Dr