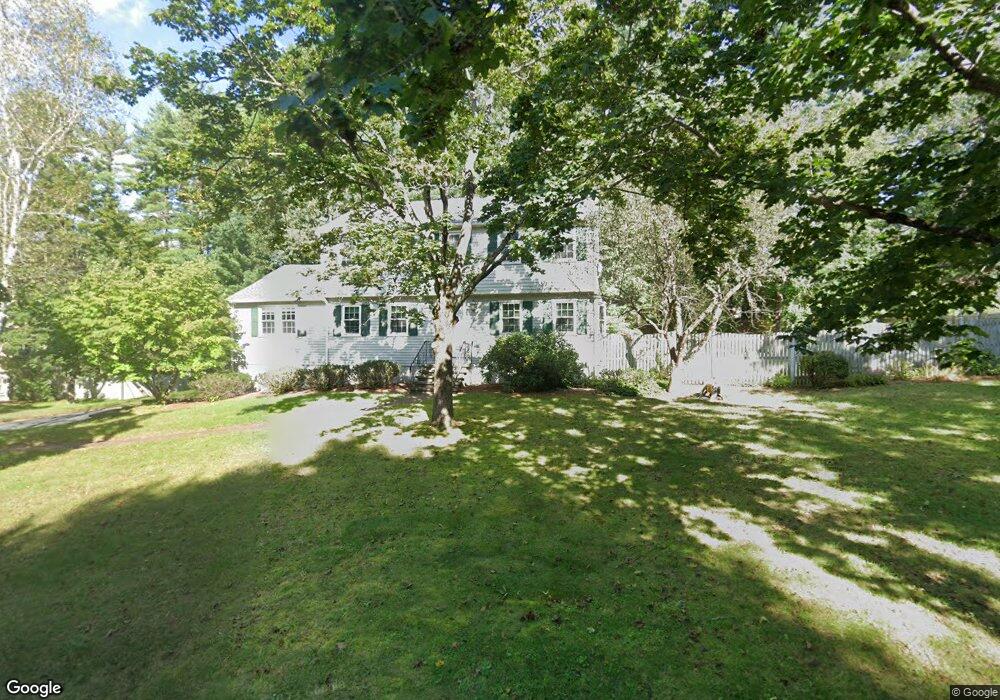
20 Tilton Ln Andover, MA 01810
Southern Andover NeighborhoodEstimated Value: $1,048,625 - $1,220,000
4
Beds
3
Baths
2,036
Sq Ft
$554/Sq Ft
Est. Value
About This Home
This home is located at 20 Tilton Ln, Andover, MA 01810 and is currently estimated at $1,128,156, approximately $554 per square foot. 20 Tilton Ln is a home located in Essex County with nearby schools including South Elementary School, Doherty Middle School, and Andover High School.
Ownership History
Date
Name
Owned For
Owner Type
Purchase Details
Closed on
Dec 3, 2010
Sold by
Paskowsky Richard S and Paskowsky Jeanne S
Bought by
Paskowsky Richard S and Paskowsky Jeanne S
Current Estimated Value
Purchase Details
Closed on
Jun 27, 1979
Bought by
Paskowsky Ft
Create a Home Valuation Report for This Property
The Home Valuation Report is an in-depth analysis detailing your home's value as well as a comparison with similar homes in the area
Home Values in the Area
Average Home Value in this Area
Purchase History
| Date | Buyer | Sale Price | Title Company |
|---|---|---|---|
| Paskowsky Richard S | -- | -- | |
| Paskowsky Richard S | -- | -- | |
| Paskowsky Richard S | -- | -- | |
| Paskowsky Ft | $89,000 | -- |
Source: Public Records
Mortgage History
| Date | Status | Borrower | Loan Amount |
|---|---|---|---|
| Previous Owner | Paskowsky Ft | $25,000 | |
| Previous Owner | Paskowsky Ft | $25,000 | |
| Previous Owner | Paskowsky Ft | $52,600 |
Source: Public Records
Tax History Compared to Growth
Tax History
| Year | Tax Paid | Tax Assessment Tax Assessment Total Assessment is a certain percentage of the fair market value that is determined by local assessors to be the total taxable value of land and additions on the property. | Land | Improvement |
|---|---|---|---|---|
| 2024 | $11,121 | $863,400 | $493,300 | $370,100 |
| 2023 | $10,653 | $779,900 | $444,200 | $335,700 |
| 2022 | $10,032 | $687,100 | $386,400 | $300,700 |
| 2021 | $9,616 | $628,900 | $351,300 | $277,600 |
| 2020 | $9,252 | $616,400 | $342,900 | $273,500 |
| 2019 | $8,898 | $582,700 | $313,200 | $269,500 |
| 2018 | $8,607 | $550,300 | $301,200 | $249,100 |
| 2017 | $8,264 | $544,400 | $295,300 | $249,100 |
| 2016 | $8,096 | $546,300 | $295,300 | $251,000 |
| 2015 | $7,814 | $522,000 | $284,000 | $238,000 |
Source: Public Records
Map
Nearby Homes