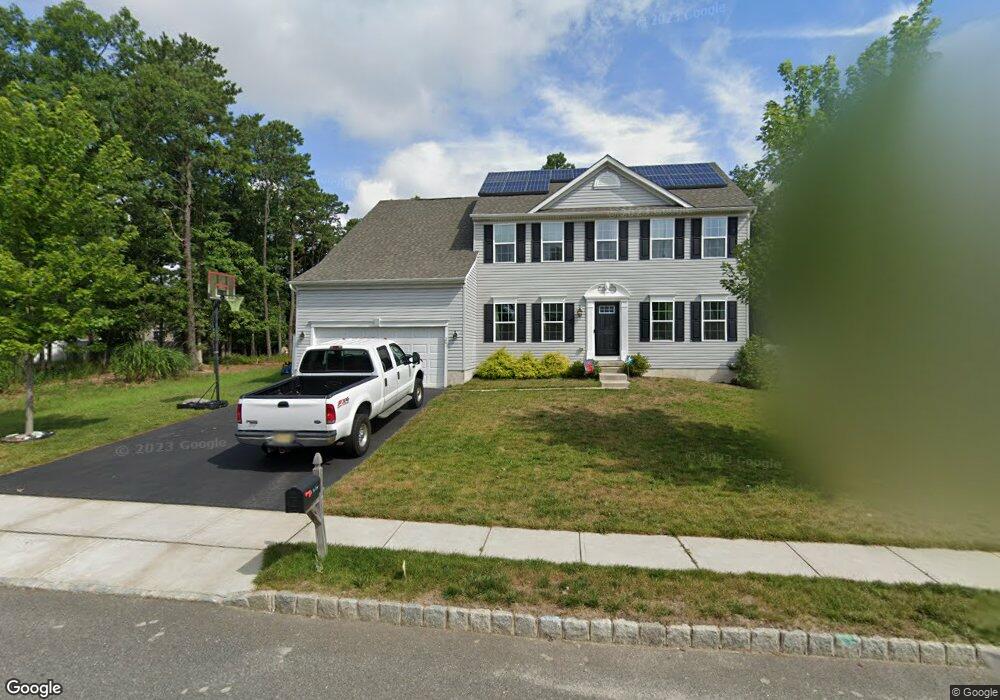
20 Tina Way Barnegat, NJ 08005
Barnegat Township NeighborhoodEstimated Value: $667,134 - $708,000
4
Beds
3
Baths
2,976
Sq Ft
$229/Sq Ft
Est. Value
About This Home
This home is located at 20 Tina Way, Barnegat, NJ 08005 and is currently estimated at $681,534, approximately $229 per square foot. 20 Tina Way is a home with nearby schools including Barnegat High School.
Ownership History
Date
Name
Owned For
Owner Type
Purchase Details
Closed on
Sep 22, 2017
Sold by
Nvr Inc
Bought by
Lutz Dennis J
Current Estimated Value
Home Financials for this Owner
Home Financials are based on the most recent Mortgage that was taken out on this home.
Original Mortgage
$366,512
Outstanding Balance
$308,188
Interest Rate
4.25%
Mortgage Type
FHA
Estimated Equity
$373,346
Purchase Details
Closed on
May 26, 2017
Sold by
Walters Development Co Llc
Bought by
Nvr Inc
Purchase Details
Closed on
May 20, 2016
Sold by
Osborn Island Properties Llc
Bought by
Walters Development Co Llc
Purchase Details
Closed on
Apr 9, 2010
Sold by
Lighthouse Development Company Inc
Bought by
Osborn Island Properties Llc
Purchase Details
Closed on
Mar 17, 2010
Sold by
Barnegat Of O A Development Llc
Bought by
Lighthouse Development Company Inc
Purchase Details
Closed on
Mar 30, 2005
Sold by
Haack Dorothy L
Bought by
Barnegat Of O A Development Llc
Purchase Details
Closed on
Aug 19, 2002
Sold by
D'Asaro Leonard
Bought by
Haack Dorothy
Create a Home Valuation Report for This Property
The Home Valuation Report is an in-depth analysis detailing your home's value as well as a comparison with similar homes in the area
Home Values in the Area
Average Home Value in this Area
Purchase History
| Date | Buyer | Sale Price | Title Company |
|---|---|---|---|
| Lutz Dennis J | $373,274 | -- | |
| Nvr Inc | $96,000 | -- | |
| Walters Development Co Llc | $40,000 | Surety Title | |
| Osborn Island Properties Llc | $80,000 | First American Title Ins Co | |
| Lighthouse Development Company Inc | -- | None Available | |
| Barnegat Of O A Development Llc | $130,000 | Fidelity National Title Insu | |
| Haack Dorothy | $16,000 | -- |
Source: Public Records
Mortgage History
| Date | Status | Borrower | Loan Amount |
|---|---|---|---|
| Open | Lutz Dennis J | $366,512 |
Source: Public Records
Tax History Compared to Growth
Tax History
| Year | Tax Paid | Tax Assessment Tax Assessment Total Assessment is a certain percentage of the fair market value that is determined by local assessors to be the total taxable value of land and additions on the property. | Land | Improvement |
|---|---|---|---|---|
| 2025 | $9,779 | $328,500 | $65,300 | $263,200 |
| 2024 | $9,563 | $328,500 | $65,300 | $263,200 |
| 2023 | $9,254 | $328,500 | $65,300 | $263,200 |
| 2022 | $9,254 | $328,500 | $65,300 | $263,200 |
| 2021 | $9,211 | $328,500 | $65,300 | $263,200 |
| 2020 | $9,168 | $328,500 | $65,300 | $263,200 |
| 2019 | $9,034 | $328,500 | $65,300 | $263,200 |
| 2018 | $8,842 | $324,000 | $65,300 | $258,700 |
| 2017 | $974 | $36,300 | $36,300 | $0 |
| 2016 | $954 | $36,300 | $36,300 | $0 |
| 2015 | $924 | $36,300 | $36,300 | $0 |
| 2014 | $901 | $36,300 | $36,300 | $0 |
Source: Public Records
Map
Nearby Homes