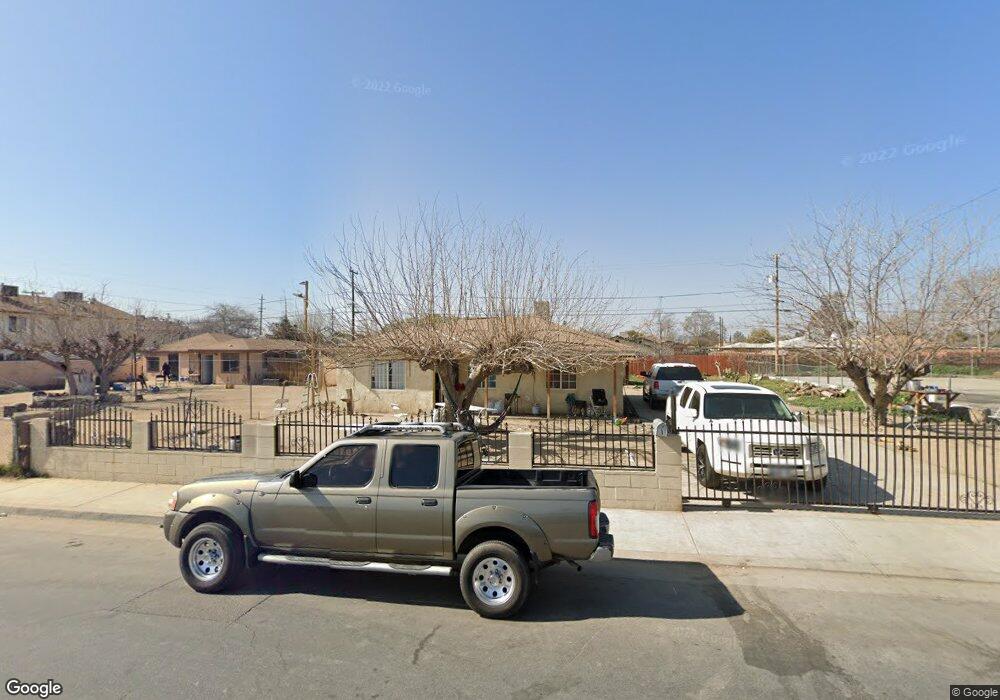
20 Tyree Toliver St Bakersfield, CA 93307
Lakeview NeighborhoodEstimated Value: $196,249 - $263,000
3
Beds
1
Bath
1,051
Sq Ft
$221/Sq Ft
Est. Value
About This Home
This home is located at 20 Tyree Toliver St, Bakersfield, CA 93307 and is currently estimated at $232,062, approximately $220 per square foot. 20 Tyree Toliver St is a home with nearby schools including Fremont Elementary School, Chipman Junior High School, and Mira Monte High School.
Ownership History
Date
Name
Owned For
Owner Type
Purchase Details
Closed on
Sep 15, 2009
Sold by
Wilmington Finance Inc
Bought by
Samaniego Petra
Current Estimated Value
Purchase Details
Closed on
Mar 5, 2009
Sold by
Ramos Martin
Bought by
Wilmington Finance Inc
Purchase Details
Closed on
Jun 18, 2007
Sold by
Barron Alice
Bought by
Ramos Martin
Home Financials for this Owner
Home Financials are based on the most recent Mortgage that was taken out on this home.
Original Mortgage
$166,500
Interest Rate
10.99%
Mortgage Type
Purchase Money Mortgage
Purchase Details
Closed on
May 24, 1999
Sold by
Vasquez Esteban A and Vassquez Ignacia S
Bought by
Martinez Olivia Reyna
Purchase Details
Closed on
Jul 30, 1996
Sold by
Vasquez Jose Guadalupe
Bought by
Barron Alice
Purchase Details
Closed on
Dec 4, 1995
Sold by
Vasquez Esteban A and Vasquez Ignacia S
Bought by
Vasquez Jose Guadalupe
Create a Home Valuation Report for This Property
The Home Valuation Report is an in-depth analysis detailing your home's value as well as a comparison with similar homes in the area
Home Values in the Area
Average Home Value in this Area
Purchase History
| Date | Buyer | Sale Price | Title Company |
|---|---|---|---|
| Samaniego Petra | $37,000 | Fidelity National Title Co | |
| Wilmington Finance Inc | $50,000 | Accommodation | |
| Ramos Martin | $185,000 | Chicago Title Company | |
| Martinez Olivia Reyna | -- | -- | |
| Barron Alice | -- | American Title Co | |
| Vasquez Jose Guadalupe | -- | -- |
Source: Public Records
Mortgage History
| Date | Status | Borrower | Loan Amount |
|---|---|---|---|
| Previous Owner | Ramos Martin | $166,500 |
Source: Public Records
Tax History Compared to Growth
Tax History
| Year | Tax Paid | Tax Assessment Tax Assessment Total Assessment is a certain percentage of the fair market value that is determined by local assessors to be the total taxable value of land and additions on the property. | Land | Improvement |
|---|---|---|---|---|
| 2025 | $1,257 | $47,632 | $12,869 | $34,763 |
| 2024 | $1,223 | $46,699 | $12,617 | $34,082 |
| 2023 | $1,223 | $45,784 | $12,370 | $33,414 |
| 2022 | $1,179 | $44,887 | $12,128 | $32,759 |
| 2021 | $1,084 | $44,008 | $11,891 | $32,117 |
| 2020 | $1,050 | $43,558 | $11,770 | $31,788 |
| 2019 | $1,030 | $43,558 | $11,770 | $31,788 |
| 2018 | $1,010 | $41,868 | $11,314 | $30,554 |
| 2017 | $1,001 | $41,048 | $11,093 | $29,955 |
| 2016 | $946 | $40,244 | $10,876 | $29,368 |
| 2015 | $935 | $39,640 | $10,713 | $28,927 |
| 2014 | $906 | $38,865 | $10,504 | $28,361 |
Source: Public Records
Map
Nearby Homes
- 116 Tyree Toliver St
- 126 Clyde St
- 30 S Owens St
- 100 S Owens St
- 120 Clifton St
- 301 Tyree Toliver St
- 101 Clifton St
- 103 Clifton St
- 11 Augusta St
- 108 Augusta St
- 200 Clifton St
- 0 Dr Martin Luther King jr Blvd Unit 202412301
- 145 Kincaid St
- 1001 Padre St
- 1012 Feliz Dr
- 1218 Feliz Dr
- 301 Kincaid St
- 314 Augusta St
- 921 Feliz Dr
- 931 Texas St