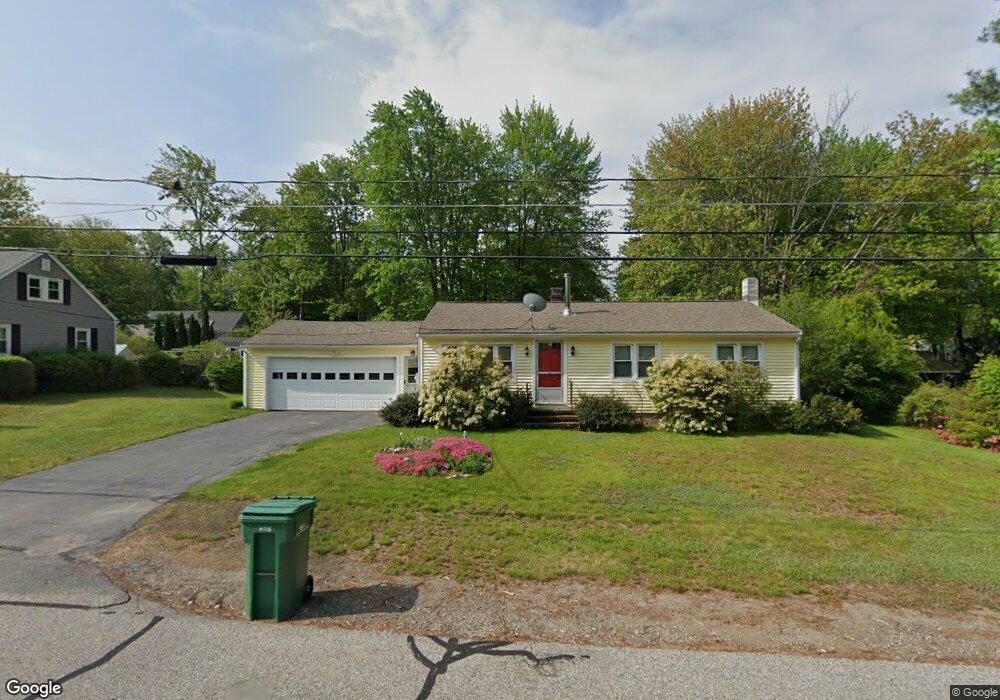
20 Vernon Ave Rochester, NH 03867
Estimated Value: $387,906 - $417,000
3
Beds
2
Baths
1,508
Sq Ft
$266/Sq Ft
Est. Value
About This Home
This home is located at 20 Vernon Ave, Rochester, NH 03867 and is currently estimated at $400,477, approximately $265 per square foot. 20 Vernon Ave is a home located in Strafford County with nearby schools including Chamberlain Street School, Rochester Middle School, and Spaulding High School.
Ownership History
Date
Name
Owned For
Owner Type
Purchase Details
Closed on
Nov 27, 2024
Sold by
Arabian Diane S
Bought by
Diane S Arabian Ret and Arabian
Current Estimated Value
Purchase Details
Closed on
Oct 20, 2008
Sold by
German Timothy R and German Katherine L
Bought by
Arabian Diane S
Home Financials for this Owner
Home Financials are based on the most recent Mortgage that was taken out on this home.
Original Mortgage
$144,000
Interest Rate
6.41%
Mortgage Type
Purchase Money Mortgage
Purchase Details
Closed on
Aug 29, 2003
Sold by
Dupuis Richard J and Dupuis Tina J
Bought by
German Timothy R and German Katherine L
Purchase Details
Closed on
May 4, 2000
Sold by
Robertson John G and Robertson Glenda A
Bought by
Dupuis Richard J and Dupuis Tina J
Purchase Details
Closed on
Jun 28, 1999
Sold by
Currier Vera K
Bought by
Robertson John G and Robertson Glenda A
Create a Home Valuation Report for This Property
The Home Valuation Report is an in-depth analysis detailing your home's value as well as a comparison with similar homes in the area
Home Values in the Area
Average Home Value in this Area
Purchase History
| Date | Buyer | Sale Price | Title Company |
|---|---|---|---|
| Diane S Arabian Ret | -- | None Available | |
| Arabian Diane S | $180,000 | -- | |
| German Timothy R | $180,000 | -- | |
| Dupuis Richard J | $105,900 | -- | |
| Robertson John G | $85,900 | -- | |
| Arabian Diane S | $180,000 | -- | |
| German Timothy R | $180,000 | -- | |
| Dupuis Richard J | $105,900 | -- | |
| Robertson John G | $85,900 | -- |
Source: Public Records
Mortgage History
| Date | Status | Borrower | Loan Amount |
|---|---|---|---|
| Previous Owner | Robertson John G | $143,310 | |
| Previous Owner | Robertson John G | $144,000 |
Source: Public Records
Tax History Compared to Growth
Tax History
| Year | Tax Paid | Tax Assessment Tax Assessment Total Assessment is a certain percentage of the fair market value that is determined by local assessors to be the total taxable value of land and additions on the property. | Land | Improvement |
|---|---|---|---|---|
| 2024 | $4,991 | $336,100 | $96,800 | $239,300 |
| 2023 | $5,189 | $201,600 | $69,000 | $132,600 |
| 2022 | $5,096 | $201,600 | $69,000 | $132,600 |
| 2021 | $4,969 | $201,600 | $69,000 | $132,600 |
| 2020 | $4,966 | $201,800 | $69,000 | $132,800 |
| 2019 | $5,025 | $201,800 | $69,000 | $132,800 |
| 2018 | $4,849 | $176,200 | $40,100 | $136,100 |
| 2017 | $4,639 | $176,200 | $40,100 | $136,100 |
| 2016 | $3,897 | $137,900 | $40,100 | $97,800 |
| 2015 | $3,882 | $137,900 | $40,100 | $97,800 |
| 2014 | $3,788 | $137,900 | $40,100 | $97,800 |
| 2013 | $4,128 | $156,600 | $57,900 | $98,700 |
| 2012 | $4,021 | $156,600 | $57,900 | $98,700 |
Source: Public Records
Map
Nearby Homes
- 19 Vernon Ave
- 17 Maplewood Ave
- 871 Salmon Falls Rd
- 616 Portland St Unit 75
- 3 Freedom Dr Unit 17
- 2 Freedom Dr
- 80 Woodland Green
- 524 Salmon Falls Rd
- 41 Kinsale Dr
- 518 & 532 Portland St
- 859 Salmon Falls Rd
- 33 Copps Dr
- 21 Copps Dr
- 17 Copps Dr
- 68 Moose Ln
- 10 Smoke St
- 27 Highland St
- 632 Salmon Falls Rd
- 22 Corson St
- 10 Lady Slipper Ct
- 18 Vernon Ave
- 22 Vernon Ave
- 19 Rochester Ave
- 19 Oakridge
- 13 Rochester Ave
- 21 Rochester Ave
- 21 Vernon Ave
- 16 Vernon Ave
- 24 Vernon Ave
- 11 Rochester Ave
- 11 Ridgeview Unit 9
- 1385 Parker Mountain Rd
- 17 Vernon Ave
- 23 Vernon Ave
- 23 Rochester Ave
- 13 Roulx Dr
- 15 Roulx Dr
- 26 Vernon Ave
- 20 Hampshire Ave
- 18 Rochester Ave