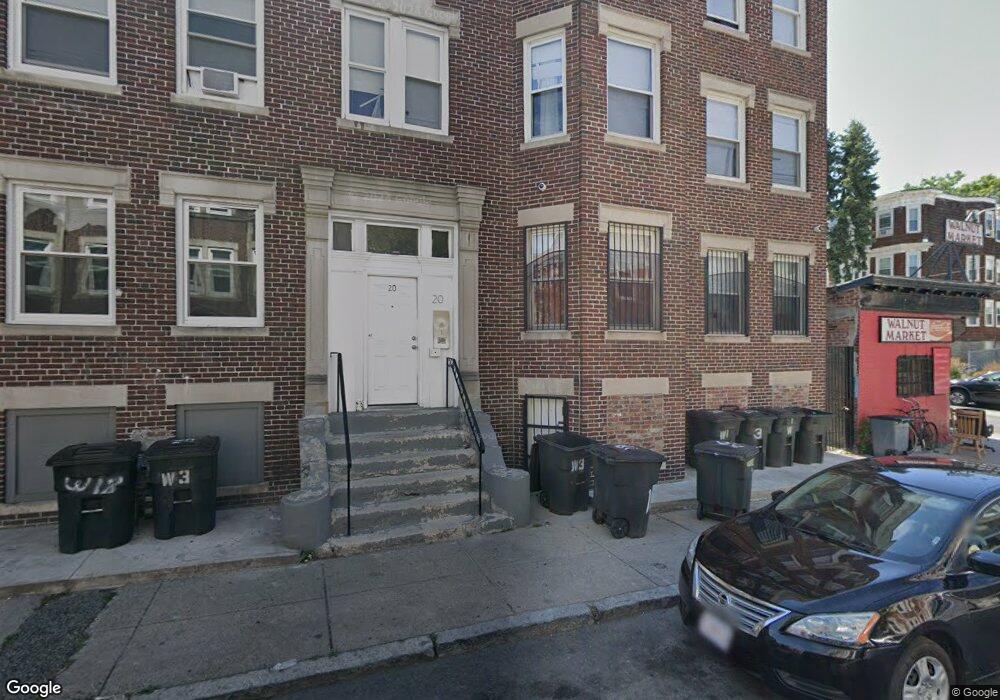
20 Wardman Rd Roxbury, MA 02119
Washington Park NeighborhoodEstimated Value: $1,045,000 - $1,389,000
9
Beds
3
Baths
4,509
Sq Ft
$280/Sq Ft
Est. Value
About This Home
This home is located at 20 Wardman Rd, Roxbury, MA 02119 and is currently estimated at $1,262,804, approximately $280 per square foot. 20 Wardman Rd is a home located in Suffolk County with nearby schools including Meridian Academy.
Ownership History
Date
Name
Owned For
Owner Type
Purchase Details
Closed on
Mar 1, 2016
Sold by
20 Wardman Road Rt and Mcelhinney
Bought by
20 Wardman Llc
Current Estimated Value
Home Financials for this Owner
Home Financials are based on the most recent Mortgage that was taken out on this home.
Original Mortgage
$625,000
Interest Rate
3.92%
Mortgage Type
Purchase Money Mortgage
Purchase Details
Closed on
Nov 19, 1993
Sold by
Fhlmc
Bought by
Mcelhinney Thomas
Purchase Details
Closed on
Mar 26, 1993
Sold by
Martin William and Federal Home Loan Mortgage Corporation
Bought by
Fhlmc
Purchase Details
Closed on
Mar 20, 1989
Sold by
-Santiago Luis
Bought by
Martin William
Home Financials for this Owner
Home Financials are based on the most recent Mortgage that was taken out on this home.
Original Mortgage
$126,400
Interest Rate
10.46%
Mortgage Type
Purchase Money Mortgage
Create a Home Valuation Report for This Property
The Home Valuation Report is an in-depth analysis detailing your home's value as well as a comparison with similar homes in the area
Home Values in the Area
Average Home Value in this Area
Purchase History
| Date | Buyer | Sale Price | Title Company |
|---|---|---|---|
| 20 Wardman Llc | $675,000 | -- | |
| Mcelhinney Thomas | $22,000 | -- | |
| Mcelhinney Thomas | $22,000 | -- | |
| Mcelhinney Thomas | $22,000 | -- | |
| Fhlmc | $143,778 | -- | |
| Fhlmc | $143,778 | -- | |
| Martin William | $158,000 | -- | |
| Martin William T | $158,000 | -- |
Source: Public Records
Mortgage History
| Date | Status | Borrower | Loan Amount |
|---|---|---|---|
| Closed | 20 Wardman Llc | $625,000 | |
| Previous Owner | Martin William T | $126,400 |
Source: Public Records
Tax History
| Year | Tax Paid | Tax Assessment Tax Assessment Total Assessment is a certain percentage of the fair market value that is determined by local assessors to be the total taxable value of land and additions on the property. | Land | Improvement |
|---|---|---|---|---|
| 2025 | $13,682 | $1,181,500 | $180,700 | $1,000,800 |
| 2024 | $12,901 | $1,183,600 | $171,000 | $1,012,600 |
| 2023 | $12,108 | $1,127,400 | $162,900 | $964,500 |
| 2022 | $11,907 | $1,094,400 | $158,100 | $936,300 |
| 2021 | $11,337 | $1,062,500 | $153,500 | $909,000 |
| 2020 | $10,309 | $976,200 | $152,900 | $823,300 |
| 2019 | $9,188 | $871,700 | $109,900 | $761,800 |
| 2018 | $6,806 | $649,392 | $91,217 | $558,175 |
| 2017 | $7,283 | $687,700 | $109,900 | $577,800 |
| 2016 | $5,672 | $515,676 | $92,316 | $423,360 |
| 2015 | $5,497 | $453,900 | $95,100 | $358,800 |
| 2014 | $5,191 | $412,600 | $95,100 | $317,500 |
Source: Public Records
Map
Nearby Homes
- 4A Weld Ave
- 31 Homestead St Unit 2
- 27 Dixwell St Unit 4
- 3106-3110 Washington St
- 1903 Columbus Ave
- 60 Iffley Rd Unit 2
- 29-31 Notre Dame St
- 26-28-30 Notre Dame St
- 39 W Walnut Park
- 3150 Washington St
- 71 Townsend St
- 218 Humboldt Ave
- 1 Copley St
- 3171 Washington St Unit 204
- 61 Montebello Rd Unit 6
- 61 Montebello Rd Unit 2
- 162 Humboldt Ave
- 20 Porter St Unit 3
- 2856 Washington St
- 12-14 Porter St Unit 12
- 20 Wardman Rd Unit 2
- 20 Wardman Rd Unit 3
- 20 Wardman Rd Unit 1
- 18 Wardman Rd Unit 3
- 18 Wardman Rd Unit 2
- 18 Wardman Rd
- 72 Walnut Park Unit 7
- 72 Walnut Park Unit 5
- 72 Walnut Park Unit 3
- 72 Walnut Park Unit 9
- 72 Walnut Park
- 16 Wardman Rd Unit 3
- 16 Wardman Rd Unit 2
- 16 Wardman Rd Unit 1
- 16 Wardman Rd Unit 1,16
- 16 Wardman Rd
- 76 Walnut Park Unit 4
- 76 Walnut Park Unit 1
- 76 Walnut Park Unit 9
- 12 Wardman Rd
Your Personal Tour Guide
Ask me questions while you tour the home.