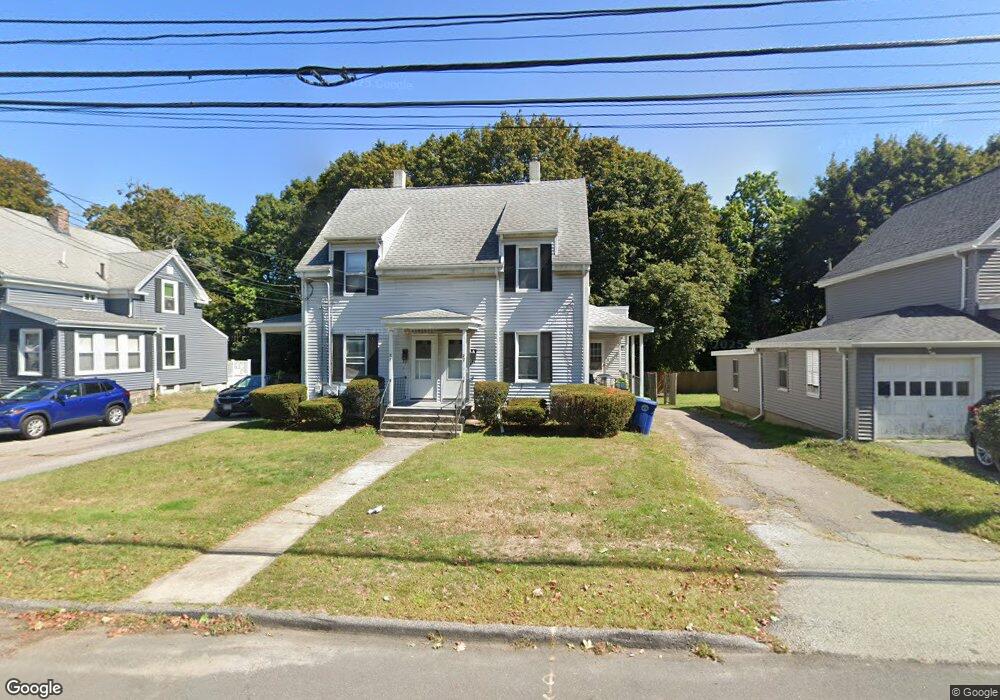
20 Wyman Rd Unit 22 Braintree, MA 02184
North Braintree NeighborhoodEstimated Value: $652,000 - $833,000
4
Beds
2
Baths
1,845
Sq Ft
$406/Sq Ft
Est. Value
About This Home
This home is located at 20 Wyman Rd Unit 22, Braintree, MA 02184 and is currently estimated at $748,268, approximately $405 per square foot. 20 Wyman Rd Unit 22 is a home located in Norfolk County with nearby schools including Braintree High School, Meeting House Montessori School, and South Shore SDA School.
Ownership History
Date
Name
Owned For
Owner Type
Purchase Details
Closed on
Jun 1, 1995
Sold by
Mcanulty Timothy J and Mcanulty Paula C
Bought by
Bernasconi James M and Bernasconi Joseph W
Current Estimated Value
Purchase Details
Closed on
Oct 31, 1991
Sold by
Chu Walt K W and Chu Selina C K
Bought by
Mcanulty Timothy J
Create a Home Valuation Report for This Property
The Home Valuation Report is an in-depth analysis detailing your home's value as well as a comparison with similar homes in the area
Home Values in the Area
Average Home Value in this Area
Purchase History
| Date | Buyer | Sale Price | Title Company |
|---|---|---|---|
| Bernasconi James M | $162,000 | -- | |
| Bernasconi James M | $162,000 | -- | |
| Mcanulty Timothy J | $186,000 | -- | |
| Mcanulty Timothy J | $186,000 | -- |
Source: Public Records
Mortgage History
| Date | Status | Borrower | Loan Amount |
|---|---|---|---|
| Open | Mcanulty Timothy J | $190,000 | |
| Closed | Mcanulty Timothy J | $173,000 | |
| Closed | Mcanulty Timothy J | $160,000 |
Source: Public Records
Tax History Compared to Growth
Tax History
| Year | Tax Paid | Tax Assessment Tax Assessment Total Assessment is a certain percentage of the fair market value that is determined by local assessors to be the total taxable value of land and additions on the property. | Land | Improvement |
|---|---|---|---|---|
| 2025 | $7,016 | $703,000 | $336,600 | $366,400 |
| 2024 | $6,116 | $645,200 | $313,800 | $331,400 |
| 2023 | $5,759 | $590,100 | $282,000 | $308,100 |
| 2022 | $5,600 | $562,800 | $254,700 | $308,100 |
| 2021 | $5,355 | $538,200 | $230,100 | $308,100 |
| 2020 | $4,887 | $495,600 | $209,200 | $286,400 |
| 2019 | $4,578 | $453,700 | $200,100 | $253,600 |
| 2018 | $4,475 | $424,600 | $181,900 | $242,700 |
| 2017 | $4,296 | $400,000 | $172,800 | $227,200 |
| 2016 | $3,836 | $349,400 | $145,500 | $203,900 |
| 2015 | $3,848 | $347,600 | $143,700 | $203,900 |
| 2014 | $3,541 | $310,100 | $131,000 | $179,100 |
Source: Public Records
Map
Nearby Homes
- 491 Washington St Unit 1
- 37 Monatiquot Ave
- 6 Oak St
- 78 Windemere Cir
- 39 Morrison Rd
- 29 Joseph Rd
- 106 Home Park Rd
- 9 Independence Ave Unit 307
- 48 Conrad St
- 305 Franklin St
- 298 Lisle St
- 1 Pantano St
- 124 Louise Rd
- 192 Federal Ave Unit B
- 74 Magnolia St
- 605 Middle St Unit 38
- 230 Lisle St
- 86 Alton Rd
- 347 Centre St
- 6 Franklin St