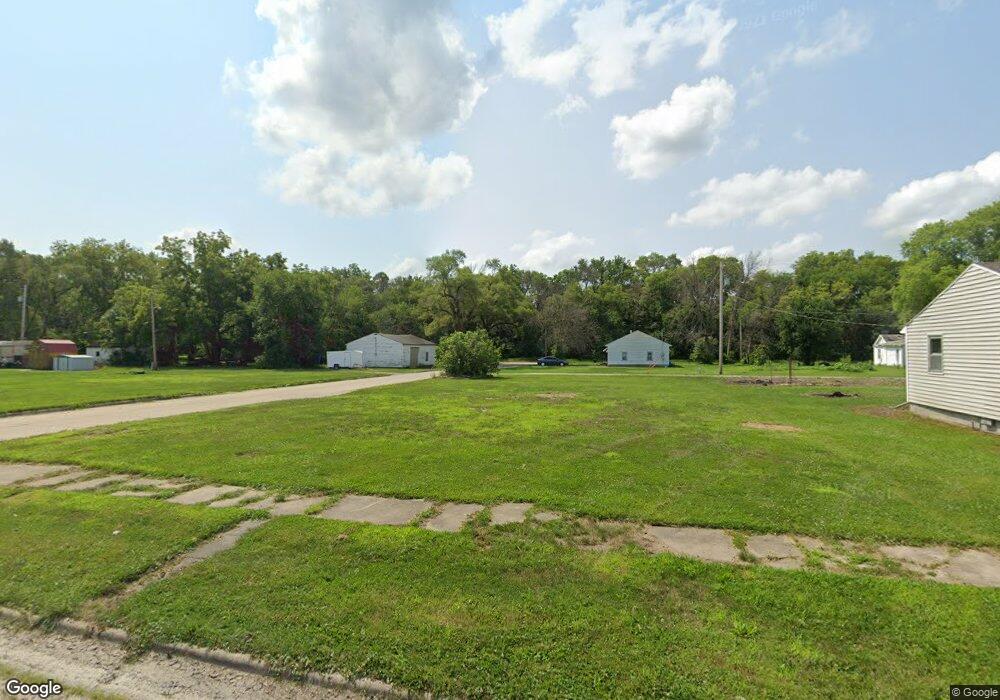
200 3rd Ave Red Oak, IA 51566
Estimated Value: $50,000 - $101,000
3
Beds
1
Bath
955
Sq Ft
$82/Sq Ft
Est. Value
About This Home
This home is located at 200 3rd Ave, Red Oak, IA 51566 and is currently estimated at $78,766, approximately $82 per square foot. 200 3rd Ave is a home located in Montgomery County with nearby schools including Red Oak Early Childhood Center, Red Oak Middle School, and Red Oak Junior/Senior High School.
Ownership History
Date
Name
Owned For
Owner Type
Purchase Details
Closed on
Oct 18, 2021
Sold by
City Of Red Oak
Bought by
Vanderhoof Rod
Current Estimated Value
Purchase Details
Closed on
Sep 9, 2005
Sold by
Miller Terry D and Miller Theresa A
Bought by
Begay Jennifer and Piper Brian
Home Financials for this Owner
Home Financials are based on the most recent Mortgage that was taken out on this home.
Original Mortgage
$14,000
Interest Rate
5.88%
Mortgage Type
New Conventional
Create a Home Valuation Report for This Property
The Home Valuation Report is an in-depth analysis detailing your home's value as well as a comparison with similar homes in the area
Home Values in the Area
Average Home Value in this Area
Purchase History
| Date | Buyer | Sale Price | Title Company |
|---|---|---|---|
| Vanderhoof Rod | -- | None Listed On Document | |
| Begay Jennifer | $14,000 | None Available |
Source: Public Records
Mortgage History
| Date | Status | Borrower | Loan Amount |
|---|---|---|---|
| Previous Owner | Begay Jennifer | $14,000 |
Source: Public Records
Tax History Compared to Growth
Tax History
| Year | Tax Paid | Tax Assessment Tax Assessment Total Assessment is a certain percentage of the fair market value that is determined by local assessors to be the total taxable value of land and additions on the property. | Land | Improvement |
|---|---|---|---|---|
| 2025 | $178 | $7,600 | $2,250 | $5,350 |
| 2024 | $178 | $7,600 | $2,250 | $5,350 |
| 2023 | $206 | $7,600 | $2,250 | $5,350 |
| 2022 | $0 | $7,600 | $2,250 | $5,350 |
| 2021 | $0 | $7,600 | $2,250 | $5,350 |
| 2020 | $0 | $7,600 | $2,250 | $5,350 |
| 2019 | $200 | $7,600 | $2,250 | $5,350 |
| 2018 | $192 | $7,600 | $0 | $0 |
| 2017 | $192 | $7,600 | $0 | $0 |
| 2015 | $182 | $7,600 | $0 | $0 |
| 2014 | $234 | $9,490 | $0 | $0 |
Source: Public Records
Map
Nearby Homes