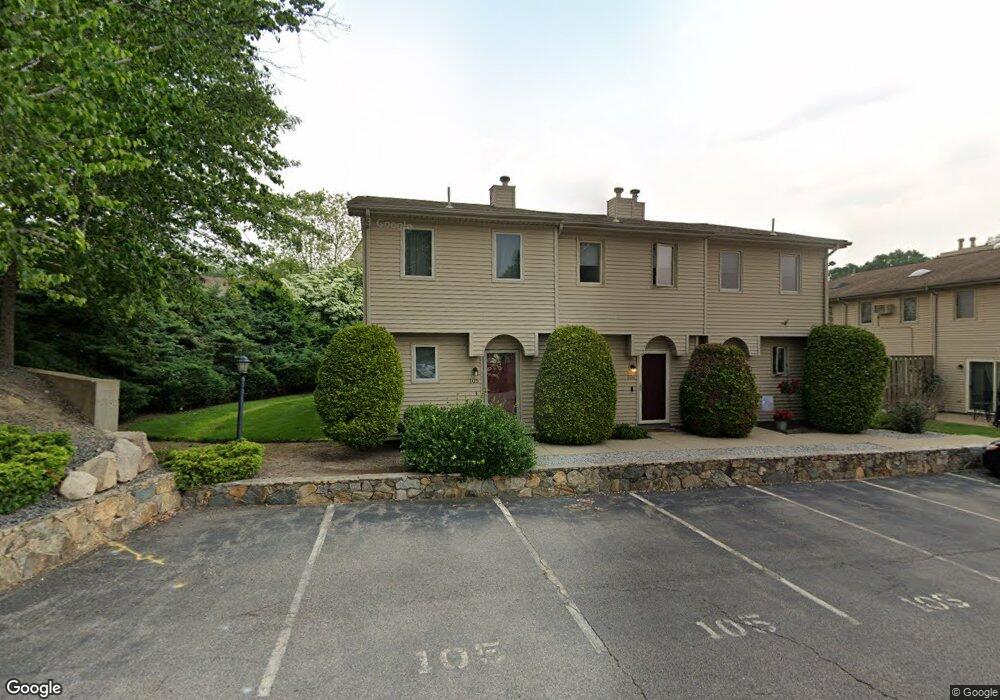
200 Cannon St Unit 14D Cranston, RI 02920
Thornton NeighborhoodEstimated Value: $317,301 - $334,000
2
Beds
2
Baths
1,232
Sq Ft
$265/Sq Ft
Est. Value
About This Home
This home is located at 200 Cannon St Unit 14D, Cranston, RI 02920 and is currently estimated at $326,325, approximately $264 per square foot. 200 Cannon St Unit 14D is a home located in Providence County with nearby schools including Stone Hill School, Western Hills Middle School, and Cranston High School West.
Ownership History
Date
Name
Owned For
Owner Type
Purchase Details
Closed on
May 31, 2017
Sold by
Calvino John N
Bought by
Coppa Melissa
Current Estimated Value
Home Financials for this Owner
Home Financials are based on the most recent Mortgage that was taken out on this home.
Original Mortgage
$155,138
Outstanding Balance
$129,544
Interest Rate
4.25%
Mortgage Type
FHA
Estimated Equity
$196,781
Purchase Details
Closed on
Apr 26, 2011
Sold by
Marseglia Frances A
Bought by
Calvino John N
Purchase Details
Closed on
Sep 13, 2005
Sold by
Jarmie Stephen M and Jarmie Andrea A
Bought by
Marseglia Frances
Purchase Details
Closed on
Jan 20, 1994
Sold by
State Street B&T Co
Bought by
Rizzo Sandra M
Home Financials for this Owner
Home Financials are based on the most recent Mortgage that was taken out on this home.
Original Mortgage
$41,350
Interest Rate
7.08%
Create a Home Valuation Report for This Property
The Home Valuation Report is an in-depth analysis detailing your home's value as well as a comparison with similar homes in the area
Home Values in the Area
Average Home Value in this Area
Purchase History
| Date | Buyer | Sale Price | Title Company |
|---|---|---|---|
| Coppa Melissa | $158,000 | -- | |
| Calvino John N | $137,500 | -- | |
| Marseglia Frances | $194,500 | -- | |
| Rizzo Sandra M | $52,000 | -- |
Source: Public Records
Mortgage History
| Date | Status | Borrower | Loan Amount |
|---|---|---|---|
| Open | Rizzo Sandra M | $155,138 | |
| Previous Owner | Rizzo Sandra M | $41,350 |
Source: Public Records
Tax History Compared to Growth
Tax History
| Year | Tax Paid | Tax Assessment Tax Assessment Total Assessment is a certain percentage of the fair market value that is determined by local assessors to be the total taxable value of land and additions on the property. | Land | Improvement |
|---|---|---|---|---|
| 2025 | $3,253 | $234,400 | $0 | $234,400 |
| 2024 | $3,190 | $234,400 | $0 | $234,400 |
| 2023 | $3,287 | $173,900 | $0 | $173,900 |
| 2022 | $3,219 | $173,900 | $0 | $173,900 |
| 2021 | $3,130 | $173,900 | $0 | $173,900 |
| 2020 | $3,047 | $146,700 | $0 | $146,700 |
| 2019 | $3,047 | $146,700 | $0 | $146,700 |
| 2018 | $2,977 | $146,700 | $0 | $146,700 |
| 2017 | $3,260 | $142,100 | $0 | $142,100 |
| 2016 | $3,190 | $142,100 | $0 | $142,100 |
| 2015 | $3,190 | $142,100 | $0 | $142,100 |
| 2014 | $2,994 | $131,100 | $0 | $131,100 |
Source: Public Records
Map
Nearby Homes
- 200 Cannon St Unit 130
- 60 Bethel St Unit B2
- 165 Holland St Unit 18
- 44 Valente Dr
- 160 Elena St
- 115 Clemence St
- 180 Elena St
- 30 Fletcher Ave
- 77 Rockwood Ave
- 00 Burton St
- 0 Clemence St
- 66 Clemence St
- 60 Harmony St
- 50 Clemence St Unit 50
- 91 Curry Rd
- 70 Pocasset St
- 149 Yeoman Ave
- 1301 Plainfield St
- 0 Plainfield Pike Unit 1374314
- 0 Spruce St
- 200 Cannon St Unit 113
- 200 Cannon St Unit 159
- 200 Cannon St Unit 12D
- 200 Cannon St Unit 11C
- 200 Cannon St Unit 19A
- 200 Cannon St Unit 19C
- 200 Cannon St Unit 9A
- 200 Cannon St Unit 3D
- 200 Cannon St Unit 15C
- 200 Cannon St Unit 10A
- 200 Cannon St Unit 19B
- 200 Cannon St Unit 16B
- 200 Cannon St Unit 18C
- 200 Cannon St Unit 11A
- 200 Cannon St Unit 3C
- 200 Cannon St Unit 17A
- 200 Cannon St Unit 8C
- 200 Cannon St Unit 8B
- 200 Cannon St Unit 8A
- 200 Cannon St Unit 3B