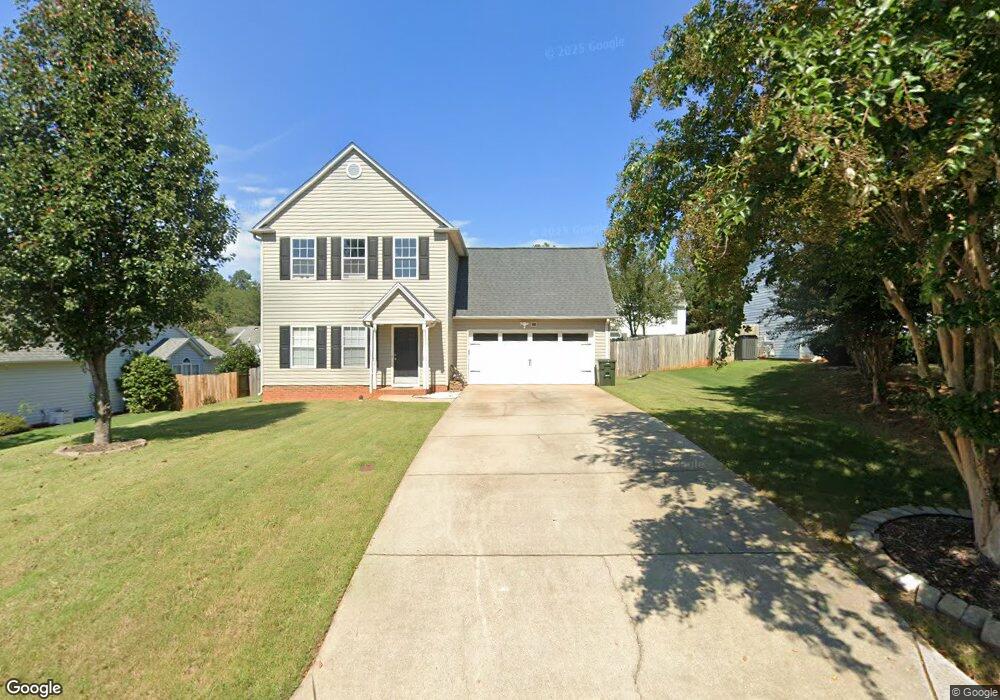
200 Canvasback Way Easley, SC 29642
Estimated Value: $246,110 - $278,000
3
Beds
3
Baths
1,523
Sq Ft
$168/Sq Ft
Est. Value
About This Home
This home is located at 200 Canvasback Way, Easley, SC 29642 and is currently estimated at $256,528, approximately $168 per square foot. 200 Canvasback Way is a home located in Pickens County with nearby schools including Forest Acres Elementary School, Richard H. Gettys Middle School, and Easley High School.
Ownership History
Date
Name
Owned For
Owner Type
Purchase Details
Closed on
Jul 10, 2015
Sold by
Cataldo Dawn S and Nalley Dawn Saxon
Bought by
Black Joshua S and Black Lisa
Current Estimated Value
Home Financials for this Owner
Home Financials are based on the most recent Mortgage that was taken out on this home.
Original Mortgage
$140,288
Outstanding Balance
$110,335
Interest Rate
4.11%
Mortgage Type
VA
Estimated Equity
$146,193
Purchase Details
Closed on
Feb 4, 2009
Sold by
Saxon Randolph J
Bought by
Cataldo Dawn S
Home Financials for this Owner
Home Financials are based on the most recent Mortgage that was taken out on this home.
Original Mortgage
$126,373
Interest Rate
5.08%
Mortgage Type
FHA
Purchase Details
Closed on
Dec 4, 2007
Sold by
Fannie Mae
Bought by
Saxon Randolph J
Purchase Details
Closed on
May 30, 2007
Sold by
Rogers Beverly J
Bought by
Federal National Mortgage Association
Create a Home Valuation Report for This Property
The Home Valuation Report is an in-depth analysis detailing your home's value as well as a comparison with similar homes in the area
Home Values in the Area
Average Home Value in this Area
Purchase History
| Date | Buyer | Sale Price | Title Company |
|---|---|---|---|
| Black Joshua S | $137,000 | None Available | |
| Cataldo Dawn S | $135,000 | -- | |
| Saxon Randolph J | -- | None Available | |
| Federal National Mortgage Association | $104,026 | Attorney |
Source: Public Records
Mortgage History
| Date | Status | Borrower | Loan Amount |
|---|---|---|---|
| Open | Black Joshua S | $140,288 | |
| Previous Owner | Cataldo Dawn S | $126,373 |
Source: Public Records
Tax History Compared to Growth
Tax History
| Year | Tax Paid | Tax Assessment Tax Assessment Total Assessment is a certain percentage of the fair market value that is determined by local assessors to be the total taxable value of land and additions on the property. | Land | Improvement |
|---|---|---|---|---|
| 2024 | $766 | $5,930 | $840 | $5,090 |
| 2023 | $766 | $5,930 | $840 | $5,090 |
| 2022 | $708 | $5,930 | $840 | $5,090 |
| 2021 | $699 | $5,930 | $840 | $5,090 |
| 2020 | $686 | $5,928 | $840 | $5,088 |
| 2019 | $691 | $5,930 | $840 | $5,090 |
| 2018 | $694 | $5,480 | $840 | $4,640 |
| 2017 | $2,095 | $5,480 | $840 | $4,640 |
| 2015 | $663 | $8,220 | $0 | $0 |
| 2008 | -- | $7,200 | $1,200 | $6,000 |
Source: Public Records
Map
Nearby Homes
- 313 Brenley Ln
- 103 Wagner Ct
- 102 Lockmere Ct
- 406 Stonewall Dr
- 405 Creek Dr
- 103 N Clearstone Ct
- 103 Malvern Hill
- 129 Creek Dr
- 182 Poplar Springs Dr
- 242 Redwood Dr
- 103 Creek Dr
- 106 Raven Ln
- 421 Wildflower Rd
- 424 Wildflower Rd
- 146 Longwood Ln
- 310 Wildflower Rd
- 424 James Rd
- 107 Barrington Ct
- 121 Red Maple Cir
- 203 Muirfield Dr
- 106 Canvasback Way
- 204 Canvasback Way
- 105 Tortuga Ln
- 109 Tortuga Ln
- 208 Canvasback Way
- 102 Canvasback Way
- 408 Mossie Smith Rd
- 100 Blue Wing Ln
- 113 Tortuga Ln
- 101 Blue Wing Ln
- 205 Canvasback Way
- 212 Canvasback Way
- 117 Tortuga Ln
- 104 Blue Wing Ln
- 209 Canvasback Way
- 216 Canvasback Way
- 108 Tortuga Ln
- 121 Tortuga Ln
- 112 Tortuga Ln
- 105 Blue Wing Ln