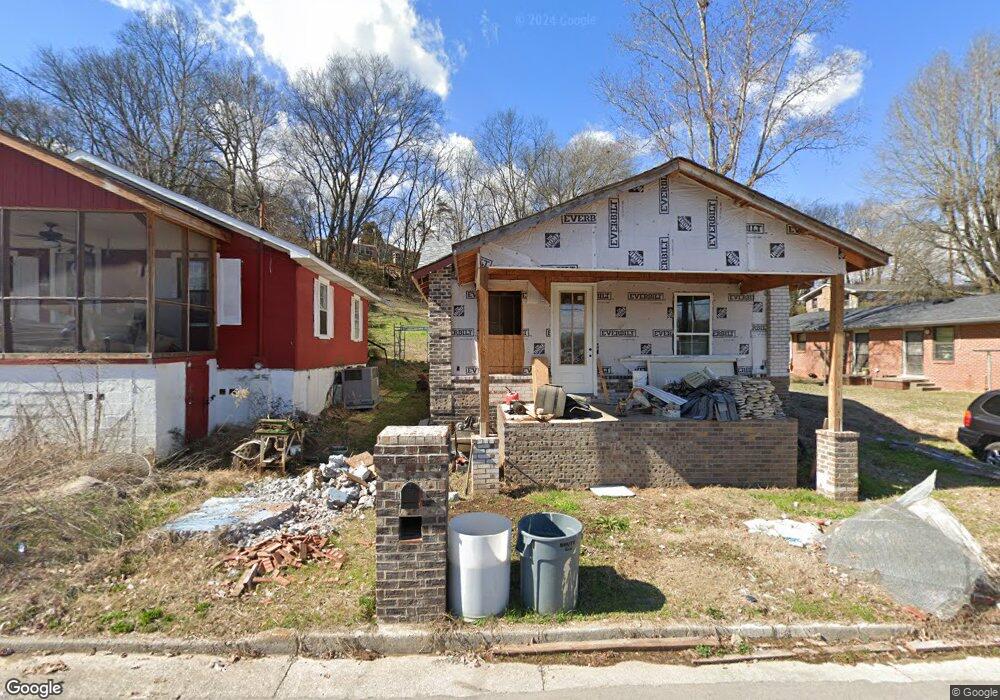
200 Collins St Loudon, TN 37774
Estimated Value: $112,471 - $199,000
--
Bed
1
Bath
894
Sq Ft
$176/Sq Ft
Est. Value
About This Home
This home is located at 200 Collins St, Loudon, TN 37774 and is currently estimated at $157,618, approximately $176 per square foot. 200 Collins St is a home located in Loudon County with nearby schools including Loudon High School.
Ownership History
Date
Name
Owned For
Owner Type
Purchase Details
Closed on
Nov 12, 2024
Sold by
Parker Johnny F and Parker Kathy Jane
Bought by
Carreto Leticia and Arevalo Rosemary Paz
Current Estimated Value
Purchase Details
Closed on
May 2, 2023
Sold by
Parker Mary J and Parker Johnny F
Bought by
Caretto Leticia and Arevalo Rosemary Paz
Purchase Details
Closed on
Jul 14, 2021
Sold by
Schrimsher Jeff and Schrimsher Lisa K
Bought by
Orozco Payan Jesus J and Gonzales Monica
Purchase Details
Closed on
Oct 5, 1999
Bought by
Schrimsher Jeff and Schrimsher Lisa K
Purchase Details
Closed on
Jun 13, 1996
Sold by
Secretary Of Housing
Bought by
Trula Curtis
Purchase Details
Closed on
Aug 2, 1995
Sold by
Sammie Arden
Bought by
Secretary Of Housing
Purchase Details
Closed on
Jun 6, 1995
Bought by
Tennessee Housing Dev 404 James Robertson Ave
Purchase Details
Closed on
Jun 21, 1994
Sold by
Barbara Brock
Bought by
Sammie Arden
Create a Home Valuation Report for This Property
The Home Valuation Report is an in-depth analysis detailing your home's value as well as a comparison with similar homes in the area
Home Values in the Area
Average Home Value in this Area
Purchase History
| Date | Buyer | Sale Price | Title Company |
|---|---|---|---|
| Carreto Leticia | $1,000 | None Listed On Document | |
| Carreto Leticia | $1,000 | None Listed On Document | |
| Carreto Leticia | $1,000 | None Listed On Document | |
| Caretto Leticia | -- | Southern Abstract & Title | |
| Orozco Payan Jesus J | $17,000 | Accommodation | |
| Schrimsher Jeff | $16,500 | -- | |
| Trula Curtis | $8,000 | -- | |
| Secretary Of Housing | $11,490 | -- | |
| Tennessee Housing Dev 404 James Robertson Ave | $11,500 | -- | |
| Sammie Arden | -- | -- |
Source: Public Records
Tax History Compared to Growth
Tax History
| Year | Tax Paid | Tax Assessment Tax Assessment Total Assessment is a certain percentage of the fair market value that is determined by local assessors to be the total taxable value of land and additions on the property. | Land | Improvement |
|---|---|---|---|---|
| 2025 | $329 | $18,100 | $1,450 | $16,650 |
| 2023 | $488 | $18,625 | $0 | $0 |
| 2022 | $488 | $18,625 | $1,975 | $16,650 |
| 2021 | $488 | $18,625 | $1,975 | $16,650 |
| 2020 | $329 | $18,625 | $1,975 | $16,650 |
| 2019 | $329 | $10,800 | $1,700 | $9,100 |
| 2018 | $322 | $10,800 | $1,700 | $9,100 |
| 2017 | $322 | $10,800 | $1,700 | $9,100 |
| 2016 | $336 | $11,075 | $1,700 | $9,375 |
| 2015 | $336 | $11,075 | $1,700 | $9,375 |
| 2014 | $357 | $11,750 | $1,700 | $10,050 |
Source: Public Records
Map
Nearby Homes