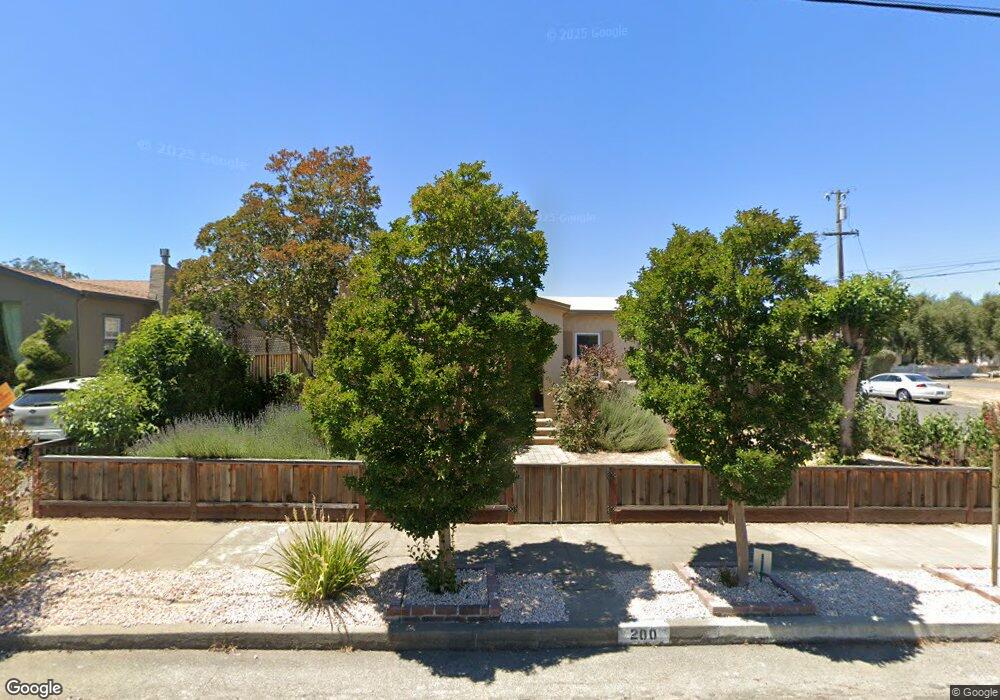
200 Dana St Petaluma, CA 94952
Western Petaluma NeighborhoodEstimated Value: $837,000 - $1,032,000
2
Beds
1
Bath
1,057
Sq Ft
$849/Sq Ft
Est. Value
About This Home
This home is located at 200 Dana St, Petaluma, CA 94952 and is currently estimated at $897,266, approximately $848 per square foot. 200 Dana St is a home located in Sonoma County with nearby schools including Valley Vista Elementary School, Petaluma Junior High School, and Petaluma High School.
Ownership History
Date
Name
Owned For
Owner Type
Purchase Details
Closed on
Sep 19, 2019
Sold by
Tibbals Kim
Bought by
Tibbals Kim and Kim F Tibbals Revocable Living
Current Estimated Value
Purchase Details
Closed on
Nov 16, 2016
Sold by
Livin Letvinchuck Barbara and Livin Barbara Letvinchuck 2001
Bought by
Tibbals Kim
Home Financials for this Owner
Home Financials are based on the most recent Mortgage that was taken out on this home.
Original Mortgage
$350,000
Outstanding Balance
$274,896
Interest Rate
2.75%
Mortgage Type
Adjustable Rate Mortgage/ARM
Estimated Equity
$622,370
Purchase Details
Closed on
May 16, 2001
Sold by
Letvinchuck Barbara and Almada Barbara J
Bought by
Livin Letvinchuck Barbara and Livin Barbara Letvinchuck 2001
Create a Home Valuation Report for This Property
The Home Valuation Report is an in-depth analysis detailing your home's value as well as a comparison with similar homes in the area
Home Values in the Area
Average Home Value in this Area
Purchase History
| Date | Buyer | Sale Price | Title Company |
|---|---|---|---|
| Tibbals Kim | -- | None Available | |
| Tibbals Kim | $610,000 | Fidelity National Title Co | |
| Livin Letvinchuck Barbara | -- | -- | |
| Livin Letvinchuck Barbara | -- | -- | |
| Livin Letvinchuck Barbara | -- | -- |
Source: Public Records
Mortgage History
| Date | Status | Borrower | Loan Amount |
|---|---|---|---|
| Open | Tibbals Kim | $350,000 |
Source: Public Records
Tax History Compared to Growth
Tax History
| Year | Tax Paid | Tax Assessment Tax Assessment Total Assessment is a certain percentage of the fair market value that is determined by local assessors to be the total taxable value of land and additions on the property. | Land | Improvement |
|---|---|---|---|---|
| 2025 | $7,671 | $707,950 | $284,339 | $423,611 |
| 2024 | $7,671 | $694,069 | $278,764 | $415,305 |
| 2023 | $7,671 | $680,461 | $273,299 | $407,162 |
| 2022 | $7,431 | $667,120 | $267,941 | $399,179 |
| 2021 | $7,291 | $654,040 | $262,688 | $391,352 |
| 2020 | $7,354 | $647,335 | $259,995 | $387,340 |
| 2019 | $7,263 | $634,644 | $254,898 | $379,746 |
| 2018 | $7,236 | $622,200 | $249,900 | $372,300 |
| 2017 | $7,085 | $610,000 | $245,000 | $365,000 |
| 2016 | $464 | $35,818 | $14,074 | $21,744 |
| 2015 | $458 | $35,281 | $13,863 | $21,418 |
| 2014 | $455 | $34,591 | $13,592 | $20,999 |
Source: Public Records
Map
Nearby Homes