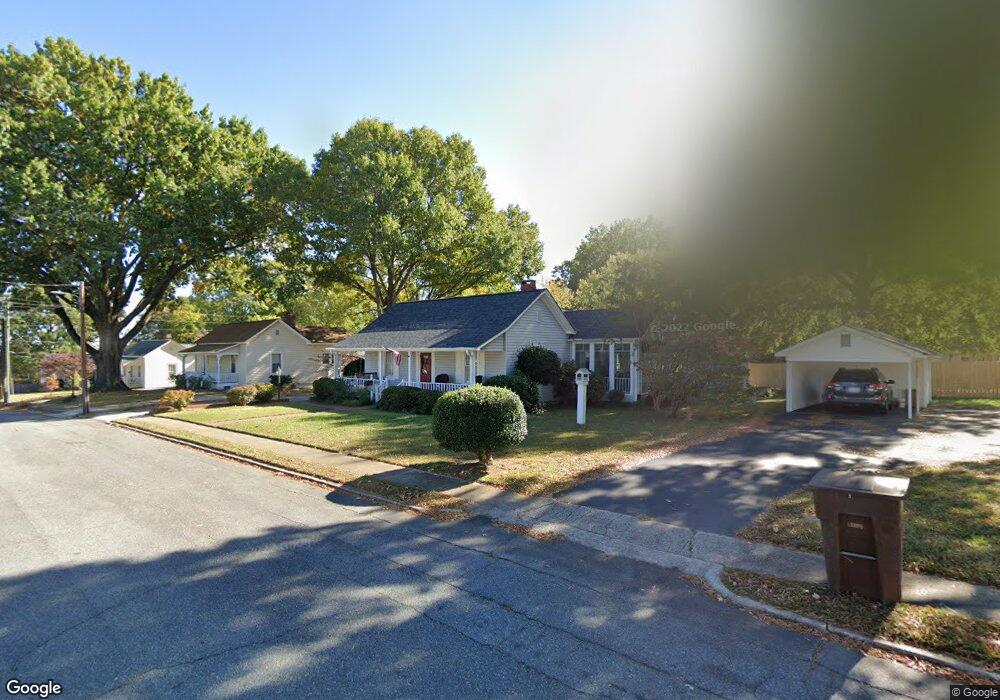
200 E 3rd St Kannapolis, NC 28083
Estimated Value: $272,085 - $316,000
3
Beds
2
Baths
1,729
Sq Ft
$171/Sq Ft
Est. Value
About This Home
This home is located at 200 E 3rd St, Kannapolis, NC 28083 and is currently estimated at $295,521, approximately $170 per square foot. 200 E 3rd St is a home located in Cabarrus County with nearby schools including North Kannapolis Elementary School, Kannapolis Middle, and A.L. Brown High School.
Ownership History
Date
Name
Owned For
Owner Type
Purchase Details
Closed on
Feb 18, 2013
Sold by
Mclain Phillip E and Mclain Jill U
Bought by
Allen John Spencer and Allen Sheena Moseley
Current Estimated Value
Home Financials for this Owner
Home Financials are based on the most recent Mortgage that was taken out on this home.
Original Mortgage
$120,000
Outstanding Balance
$54,196
Interest Rate
3.4%
Mortgage Type
New Conventional
Estimated Equity
$241,325
Purchase Details
Closed on
Oct 1, 1985
Bought by
Jenkins Henry G
Create a Home Valuation Report for This Property
The Home Valuation Report is an in-depth analysis detailing your home's value as well as a comparison with similar homes in the area
Home Values in the Area
Average Home Value in this Area
Purchase History
| Date | Buyer | Sale Price | Title Company |
|---|---|---|---|
| Allen John Spencer | $120,000 | None Available | |
| Jenkins Henry G | $24,000 | -- |
Source: Public Records
Mortgage History
| Date | Status | Borrower | Loan Amount |
|---|---|---|---|
| Open | Allen John Spencer | $120,000 |
Source: Public Records
Tax History Compared to Growth
Tax History
| Year | Tax Paid | Tax Assessment Tax Assessment Total Assessment is a certain percentage of the fair market value that is determined by local assessors to be the total taxable value of land and additions on the property. | Land | Improvement |
|---|---|---|---|---|
| 2025 | $2,912 | $256,440 | $44,000 | $212,440 |
| 2024 | $2,912 | $256,440 | $44,000 | $212,440 |
| 2023 | $2,107 | $153,800 | $32,000 | $121,800 |
| 2022 | $2,107 | $153,800 | $32,000 | $121,800 |
| 2021 | $2,107 | $153,800 | $32,000 | $121,800 |
| 2020 | $2,107 | $153,800 | $32,000 | $121,800 |
| 2019 | $1,646 | $120,140 | $17,000 | $103,140 |
| 2018 | $1,622 | $120,140 | $17,000 | $103,140 |
| 2017 | $1,598 | $120,140 | $17,000 | $103,140 |
| 2016 | $1,598 | $123,330 | $23,000 | $100,330 |
| 2015 | $1,554 | $123,330 | $23,000 | $100,330 |
| 2014 | $1,554 | $123,330 | $23,000 | $100,330 |
Source: Public Records
Map
Nearby Homes