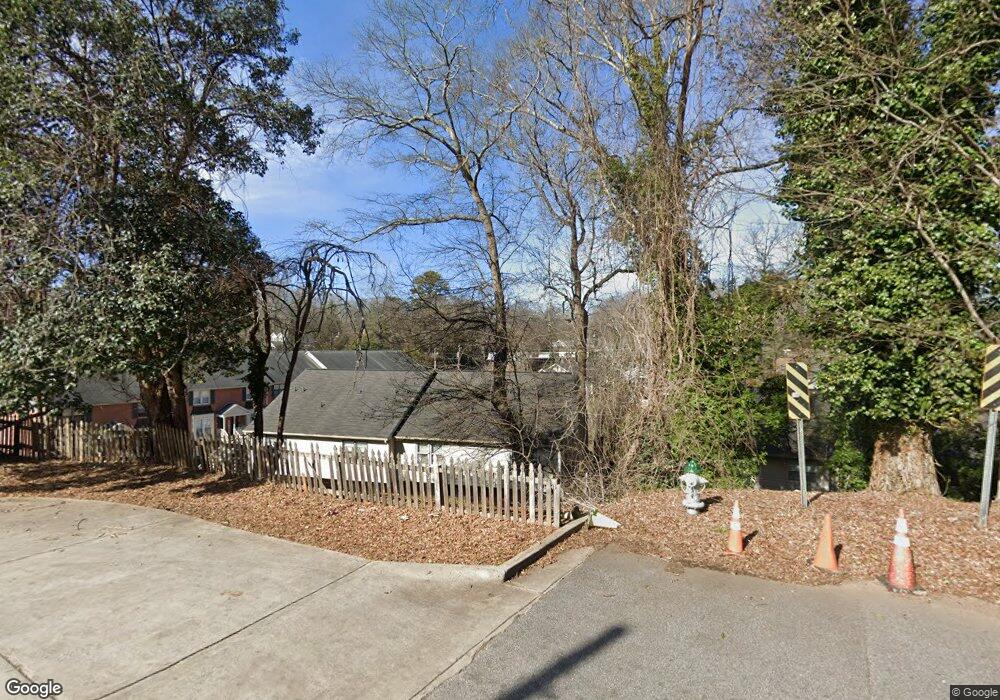
200 E Cloverhurst Ave Athens, GA 30605
Midtown-Bloomfield NeighborhoodEstimated Value: $394,000 - $434,000
--
Bed
2
Baths
1,184
Sq Ft
$352/Sq Ft
Est. Value
About This Home
This home is located at 200 E Cloverhurst Ave, Athens, GA 30605 and is currently estimated at $416,535, approximately $351 per square foot. 200 E Cloverhurst Ave is a home located in Clarke County with nearby schools including Barrow Elementary School, Clarke Middle School, and Clarke Central High School.
Ownership History
Date
Name
Owned For
Owner Type
Purchase Details
Closed on
Jun 30, 2011
Sold by
Athens Equities Llc
Bought by
Leapp Ventures Llc
Current Estimated Value
Purchase Details
Closed on
Jun 9, 2005
Sold by
Parker Kenneth B and Parker Susan
Bought by
Athens Equities Llc
Home Financials for this Owner
Home Financials are based on the most recent Mortgage that was taken out on this home.
Original Mortgage
$100,500
Interest Rate
5.7%
Mortgage Type
New Conventional
Purchase Details
Closed on
Mar 15, 2000
Sold by
Mv Holding Company Llc
Bought by
Athens Equities Llc
Purchase Details
Closed on
Oct 14, 1998
Sold by
Vrana Mark
Bought by
Mv Holding Company Llc
Purchase Details
Closed on
Jun 1, 1998
Sold by
Mcdonald Philip C
Bought by
Vrana Mark
Purchase Details
Closed on
Apr 1, 1994
Sold by
Rennie John C and Rennie Carol J
Bought by
Mcdonald Philip C
Create a Home Valuation Report for This Property
The Home Valuation Report is an in-depth analysis detailing your home's value as well as a comparison with similar homes in the area
Home Values in the Area
Average Home Value in this Area
Purchase History
| Date | Buyer | Sale Price | Title Company |
|---|---|---|---|
| Leapp Ventures Llc | $142,000 | -- | |
| Athens Equities Llc | -- | -- | |
| Athens Equities Llc | $84,000 | -- | |
| Mv Holding Company Llc | -- | -- | |
| Vrana Mark | $77,000 | -- | |
| Mcdonald Philip C | $63,000 | -- |
Source: Public Records
Mortgage History
| Date | Status | Borrower | Loan Amount |
|---|---|---|---|
| Previous Owner | Athens Equities Llc | $100,500 |
Source: Public Records
Tax History Compared to Growth
Tax History
| Year | Tax Paid | Tax Assessment Tax Assessment Total Assessment is a certain percentage of the fair market value that is determined by local assessors to be the total taxable value of land and additions on the property. | Land | Improvement |
|---|---|---|---|---|
| 2024 | $3,932 | $125,823 | $16,000 | $109,823 |
| 2023 | $3,932 | $110,568 | $14,000 | $96,568 |
| 2022 | $2,572 | $80,618 | $14,000 | $66,618 |
| 2021 | $2,235 | $66,334 | $14,000 | $52,334 |
| 2020 | $2,208 | $65,515 | $14,000 | $51,515 |
| 2019 | $1,984 | $58,428 | $14,000 | $44,428 |
| 2018 | $1,831 | $53,933 | $14,000 | $39,933 |
| 2017 | $1,831 | $53,933 | $14,000 | $39,933 |
| 2016 | $1,808 | $53,241 | $14,000 | $39,241 |
| 2015 | $1,810 | $53,241 | $14,000 | $39,241 |
| 2014 | $1,830 | $53,732 | $14,000 | $39,732 |
Source: Public Records
Map
Nearby Homes
- 174 Talmadge St Unit 18
- 997 S Milledge Ave Unit 3
- 997 S Milledge Ave Unit 2
- 997 S Milledge Ave Unit 1
- 494 Baxter St Unit 32
- 1070 S Milledge Ave
- 365 S Church St Unit 1B
- 365 S Church St Unit 1C
- 365 S Church St Unit 1A
- 365 S Church #1c St
- 365 S Church #1b St
- 365 S Church #1a St
- 497 W Rutherford St
- 515 Hampton Ct
- 495 Woodlawn Ave
- 577 W Cloverhurst Ave
- 490 Ofarrell St
- 1055 Baxter St Unit 502
- 430 Milledge Cir
- 200 E Cloverhurst Ave Unit 8
- 200 E Cloverhurst Ave Unit 4
- 200 E Cloverhurst Ave Unit 10
- 200 E Cloverhurst Ave Unit 16
- 200 E Cloverhurst Ave Unit 2
- 200 E Cloverhurst Ave
- 200 E Cloverhurst Ave Unit 7
- 200 E Cloverhurst Ave
- 200 E Cloverhurst Ave
- 200 E Cloverhurst Ave
- 200 E Cloverhurst Ave
- 200 E Cloverhurst Ave
- 200 E Cloverhurst Ave
- 200 E Cloverhurst Ave
- 200 E Cloverhurst Ave
- 200 E Cloverhurst Ave
- 200 E Cloverhurst Ave
- 200 E Cloverhurst Ave
- 200 E Cloverhurst Ave
- 200 E Cloverhurst Ave