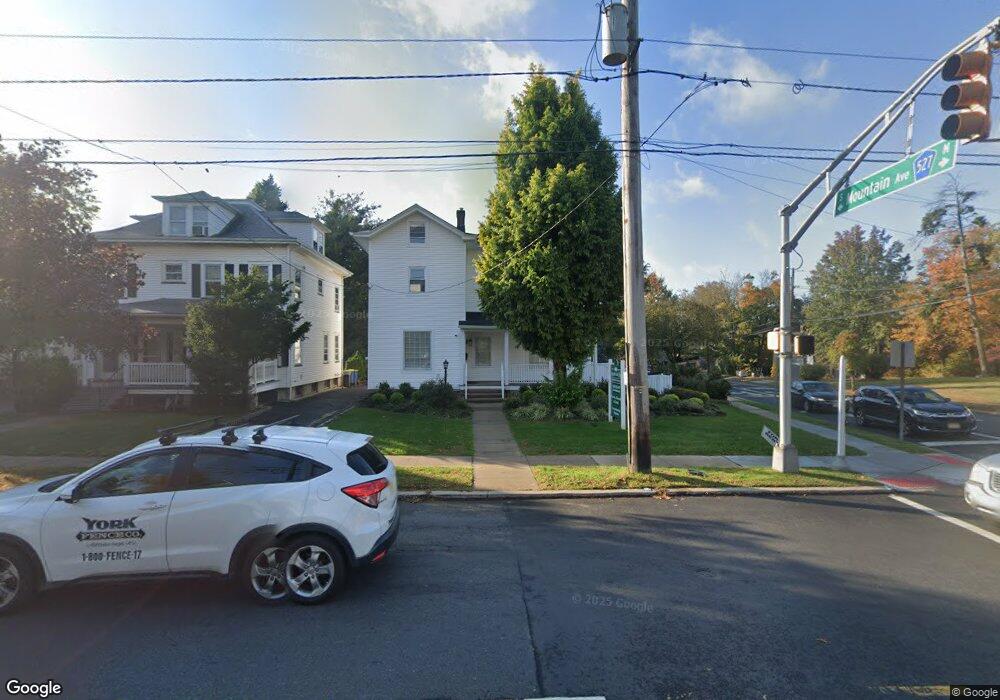
200 E Union Ave Unit 1 Bound Brook, NJ 08805
Estimated Value: $536,550
Studio
--
Bath
2,120
Sq Ft
$253/Sq Ft
Est. Value
About This Home
This home is located at 200 E Union Ave Unit 1, Bound Brook, NJ 08805 and is currently estimated at $536,550, approximately $253 per square foot. 200 E Union Ave Unit 1 is a home located in Somerset County with nearby schools including LaMonte Annex Elementary School, Lafayette Elementary School, and Bound Brook High School.
Ownership History
Date
Name
Owned For
Owner Type
Purchase Details
Closed on
Jun 3, 2024
Sold by
East Union 200 Llc
Bought by
200 East Union Avenue Llc
Current Estimated Value
Purchase Details
Closed on
Jun 13, 2023
Sold by
Slater Susan M
Bought by
East Union 200 Llc
Home Financials for this Owner
Home Financials are based on the most recent Mortgage that was taken out on this home.
Original Mortgage
$266,500
Interest Rate
3%
Mortgage Type
New Conventional
Purchase Details
Closed on
Sep 11, 1998
Sold by
Maher Frances
Bought by
Slater Susan
Home Financials for this Owner
Home Financials are based on the most recent Mortgage that was taken out on this home.
Original Mortgage
$136,000
Interest Rate
6.9%
Mortgage Type
Commercial
Purchase Details
Closed on
Feb 20, 1991
Sold by
Maher Frances
Bought by
Maher Frances
Purchase Details
Closed on
Jul 16, 1990
Sold by
Galeta Thomas C
Bought by
Morano Frank J and Morano Vincenza A
Create a Home Valuation Report for This Property
The Home Valuation Report is an in-depth analysis detailing your home's value as well as a comparison with similar homes in the area
Home Values in the Area
Average Home Value in this Area
Purchase History
| Date | Buyer | Sale Price | Title Company |
|---|---|---|---|
| 200 East Union Avenue Llc | $500,000 | Chicago Title | |
| East Union 200 Llc | $410,000 | None Listed On Document | |
| Slater Susan | $170,000 | -- | |
| Maher Frances | -- | -- | |
| Morano Frank J | $235,000 | -- |
Source: Public Records
Mortgage History
| Date | Status | Borrower | Loan Amount |
|---|---|---|---|
| Previous Owner | East Union 200 Llc | $266,500 | |
| Previous Owner | Slater Susan | $136,000 |
Source: Public Records
Tax History
| Year | Tax Paid | Tax Assessment Tax Assessment Total Assessment is a certain percentage of the fair market value that is determined by local assessors to be the total taxable value of land and additions on the property. | Land | Improvement |
|---|---|---|---|---|
| 2025 | $10,058 | $474,200 | $257,000 | $217,200 |
| 2024 | $10,058 | $443,300 | $232,000 | $211,300 |
Source: Public Records
Map
Nearby Homes
- 315 East St
- 328 John St
- 306 Church St
- 112 East St
- 589 Mountain Ave
- 520 Winsor St
- 17 Talmage Ave
- 650 Central Ave
- 126 W High St
- 730 Park Ave
- 162 Linden Ave
- 265 Metape Cir S
- 303 Ashland Rd
- 216 Chestnut St
- 811 Mountain Ave
- 20 van Syckle Blvd
- 9 Swing Bridge Ln Unit 118
- 261 W Main St
- 116 Greene Ave
- 561 Marion St
- 200 E Union Ave Unit Bound Brook
- 200 E Union Ave
- 206 E Union Ave
- 338 Mountain Ave
- 210 E Union Ave
- 334 Mountain Ave
- 214 E Union Ave Unit 4
- 333 Hamilton St
- 203 E Union Ave
- 329 Hamilton St
- 330 Mountain Ave
- 209 E Union Ave
- 410 Mountain Ave
- 333 Mountain Ave
- 211 E Union Ave
- 155 E Union Ave
- 120 E Union Ave
- 120 E Union Ave Unit 120
- 325 Hamilton St
- 325 Hamilton St Unit 2
Your Personal Tour Guide
Ask me questions while you tour the home.