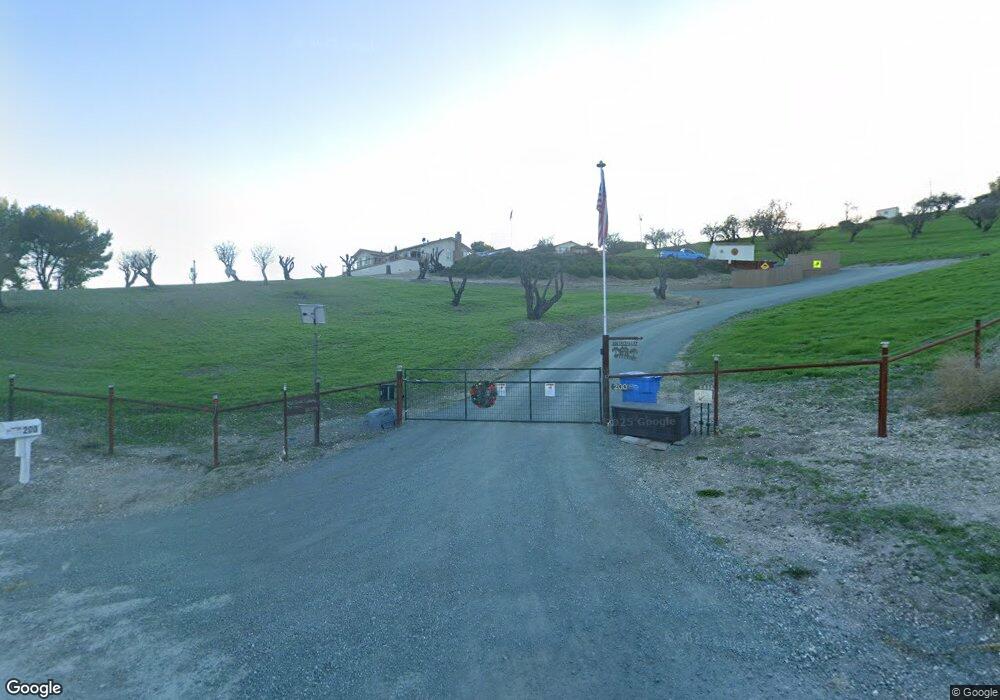
200 Encinal St Paso Robles, CA 93446
Estimated Value: $733,000 - $1,070,000
3
Beds
2
Baths
1,570
Sq Ft
$574/Sq Ft
Est. Value
About This Home
This home is located at 200 Encinal St, Paso Robles, CA 93446 and is currently estimated at $900,412, approximately $573 per square foot. 200 Encinal St is a home located in San Luis Obispo County with nearby schools including Glen Speck Elementary School, George H. Flamson Middle School, and Paso Robles High School.
Ownership History
Date
Name
Owned For
Owner Type
Purchase Details
Closed on
Feb 18, 2014
Sold by
Johnson Elaine L and Johnson Rose M
Bought by
Johnson Elaine L and Johnson Rose M
Current Estimated Value
Home Financials for this Owner
Home Financials are based on the most recent Mortgage that was taken out on this home.
Original Mortgage
$190,000
Outstanding Balance
$143,589
Interest Rate
4.34%
Mortgage Type
New Conventional
Estimated Equity
$756,823
Purchase Details
Closed on
Feb 4, 2010
Sold by
Bagger Timothy Jon
Bought by
Johnson Elaine L and Johnson Rose M
Home Financials for this Owner
Home Financials are based on the most recent Mortgage that was taken out on this home.
Original Mortgage
$180,000
Interest Rate
4.97%
Mortgage Type
New Conventional
Purchase Details
Closed on
Mar 24, 2004
Sold by
Bagger Timothy Jon and Bagger Timothy J
Bought by
Bagger Timothy Jon
Purchase Details
Closed on
Apr 2, 1999
Sold by
Bagger Leslie Marie
Bought by
Bagger Timothy Jon
Create a Home Valuation Report for This Property
The Home Valuation Report is an in-depth analysis detailing your home's value as well as a comparison with similar homes in the area
Purchase History
| Date | Buyer | Sale Price | Title Company |
|---|---|---|---|
| Johnson Elaine L | -- | First American Title Company | |
| Johnson Elaine L | -- | First American Title Company | |
| Johnson Elaine L | $365,000 | Fidelity National Title Co | |
| Bagger Timothy Jon | -- | -- | |
| Bagger Timothy Jon | -- | -- |
Source: Public Records
Mortgage History
| Date | Status | Borrower | Loan Amount |
|---|---|---|---|
| Open | Johnson Elaine L | $190,000 | |
| Previous Owner | Johnson Elaine L | $180,000 |
Source: Public Records
Tax History
| Year | Tax Paid | Tax Assessment Tax Assessment Total Assessment is a certain percentage of the fair market value that is determined by local assessors to be the total taxable value of land and additions on the property. | Land | Improvement |
|---|---|---|---|---|
| 2025 | $5,083 | $487,540 | $284,189 | $203,351 |
| 2024 | $4,990 | $477,981 | $278,617 | $199,364 |
| 2023 | $4,990 | $468,609 | $273,154 | $195,455 |
| 2022 | $4,903 | $459,422 | $267,799 | $191,623 |
| 2021 | $4,805 | $450,415 | $262,549 | $187,866 |
| 2020 | $4,593 | $430,797 | $247,857 | $182,940 |
| 2019 | $4,501 | $422,351 | $242,998 | $179,353 |
| 2018 | $4,411 | $414,071 | $238,234 | $175,837 |
| 2017 | $4,130 | $405,953 | $233,563 | $172,390 |
| 2016 | $4,047 | $397,994 | $228,984 | $169,010 |
| 2015 | $3,985 | $392,017 | $225,545 | $166,472 |
| 2014 | $3,833 | $384,339 | $221,127 | $163,212 |
Source: Public Records
Map
Nearby Homes
- 270 Almira Park Way
- 201 Encinal St
- 325 Kiler Canyon Rd
- 14 Almira Park Way
- 250 Encinal St
- 310 Almira Park Way
- 188 Encinal St
- 285 S Vine St
- 478 Encinal St
- 325 S Vine St
- 345 Almira Park Way
- 475 S Vine St
- 195 S Vine St
- 189 S Vine St
- 215 S Vine St
- 185 S Vine St
- 695 S Vine St
- 725 S Vine St
- 236 S Vine St
- 230 S Vine St
Your Personal Tour Guide
Ask me questions while you tour the home.