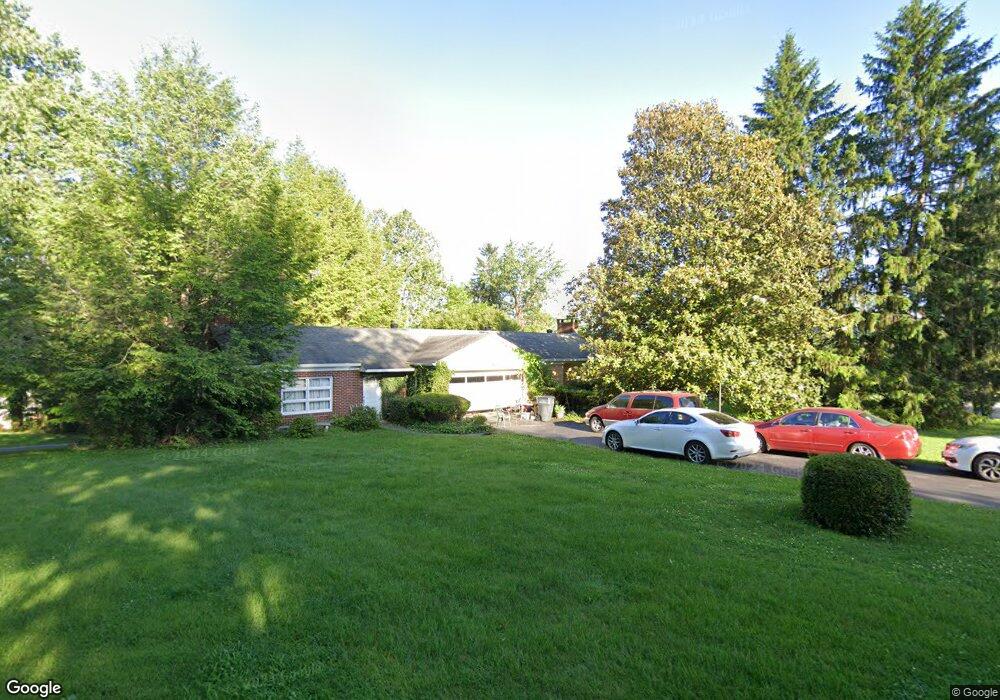
200 Fieldcrest Rd Bristol, TN 37620
Estimated Value: $278,358 - $399,000
Studio
3
Baths
1,533
Sq Ft
$230/Sq Ft
Est. Value
About This Home
This home is located at 200 Fieldcrest Rd, Bristol, TN 37620 and is currently estimated at $351,840, approximately $229 per square foot. 200 Fieldcrest Rd is a home located in Sullivan County with nearby schools including Anderson Elementary School, Vance Middle School, and Tennessee High School.
Ownership History
Date
Name
Owned For
Owner Type
Purchase Details
Closed on
Oct 19, 2018
Sold by
Beavers Nancy K
Bought by
Greeson Jamie B
Current Estimated Value
Purchase Details
Closed on
Sep 7, 2001
Sold by
Timothy Hudson
Bought by
Betty Allen
Home Financials for this Owner
Home Financials are based on the most recent Mortgage that was taken out on this home.
Original Mortgage
$124,000
Interest Rate
6.97%
Purchase Details
Closed on
Jun 4, 2001
Sold by
Milton Abercrombie
Bought by
Thomas Beavers
Home Financials for this Owner
Home Financials are based on the most recent Mortgage that was taken out on this home.
Original Mortgage
$60,000
Interest Rate
7.11%
Purchase Details
Closed on
Jun 1, 2001
Home Financials for this Owner
Home Financials are based on the most recent Mortgage that was taken out on this home.
Original Mortgage
$60,000
Interest Rate
7.11%
Purchase Details
Closed on
Sep 3, 1998
Create a Home Valuation Report for This Property
The Home Valuation Report is an in-depth analysis detailing your home's value as well as a comparison with similar homes in the area
Purchase History
| Date | Buyer | Sale Price | Title Company |
|---|---|---|---|
| Greeson Jamie B | -- | None Available | |
| Betty Allen | $155,000 | -- | |
| Thomas Beavers | $139,950 | -- | |
| -- | $140,000 | -- | |
| -- | $125,000 | -- |
Source: Public Records
Mortgage History
| Date | Status | Borrower | Loan Amount |
|---|---|---|---|
| Previous Owner | -- | $124,000 | |
| Previous Owner | -- | $60,000 | |
| Previous Owner | -- | $60,000 |
Source: Public Records
Tax History
| Year | Tax Paid | Tax Assessment Tax Assessment Total Assessment is a certain percentage of the fair market value that is determined by local assessors to be the total taxable value of land and additions on the property. | Land | Improvement |
|---|---|---|---|---|
| 2025 | -- | $98,300 | $7,225 | $91,075 |
| 2024 | -- | $52,350 | $10,000 | $42,350 |
| 2023 | $2,300 | $52,350 | $10,000 | $42,350 |
| 2022 | $2,300 | $52,350 | $10,000 | $42,350 |
| 2021 | $2,299 | $52,350 | $10,000 | $42,350 |
| 2020 | $1,271 | $52,350 | $10,000 | $42,350 |
| 2019 | $2,340 | $49,450 | $10,000 | $39,450 |
| 2018 | $2,330 | $49,450 | $10,000 | $39,450 |
| 2017 | $2,330 | $49,450 | $10,000 | $39,450 |
| 2016 | $2,159 | $44,750 | $8,000 | $36,750 |
| 2014 | $2,038 | $44,738 | $0 | $0 |
Source: Public Records
Map
Nearby Homes
- Lot'S 6&7 Skyline Dr
- Lot 13 Skyline Dr
- 100 Earlway Rd
- Tbd Kelly Ridge Rd
- 1713 Edgemont Ave
- 1601 Edgemont Ave
- 1224 7th Ave
- 146 Cloudland Dr
- 1520 Tremont Ave
- 1103 Glen St
- 2118 King College Rd
- 251 Bellebrook Rd
- 257 Bellebrook Rd
- 1120 Barber Rd
- 261 Bellebrook Rd
- 2222 Windsor Ave
- 2645 Anderson St
- 101 Queen St
- 100 Martindale Rd
- Tbd Clifton Rd
- 0 Fieldcrest Rd
- 102 Mimosa Rd
- 300 Fieldcrest Rd
- 105 Mimosa Rd
- 111 Fieldcrest Rd
- 308 Fieldcrest Rd
- 100 Maple Tree Dr
- 102 Maple Tree Dr
- 101 Mimosa Rd
- 107 Fieldcrest Rd
- 1758 Holston Dr
- 304 Fieldcrest Rd
- 200 Maple Tree Dr
- 212 Maple Tree Dr
- 208 Maple Tree Dr
- 1754 Holston Dr
- 214 Maple Tree Dr
- 103 Fieldcrest Rd
- 108 Leafmore Ln
- 206 Maple Tree Dr
Your Personal Tour Guide
Ask me questions while you tour the home.