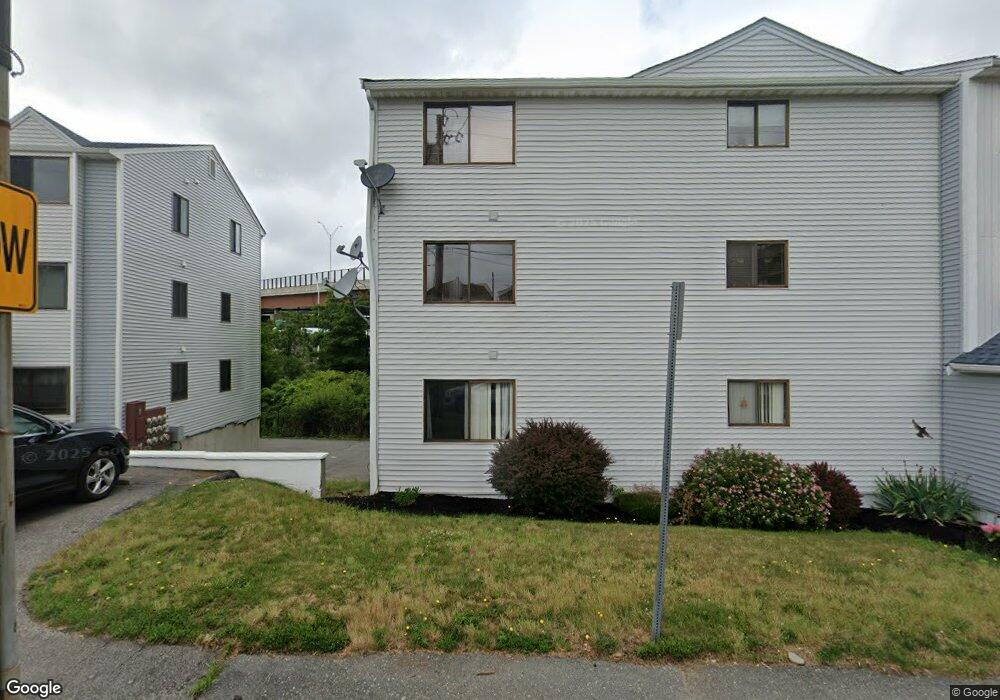
200 Fulton St Unit 29 Fall River, MA 02720
Western Fall River NeighborhoodEstimated Value: $256,000 - $288,260
2
Beds
2
Baths
1,116
Sq Ft
$239/Sq Ft
Est. Value
About This Home
This home is located at 200 Fulton St Unit 29, Fall River, MA 02720 and is currently estimated at $266,815, approximately $239 per square foot. 200 Fulton St Unit 29 is a home located in Bristol County with nearby schools including North End Elementary School, Morton Middle School, and B M C Durfee High School.
Ownership History
Date
Name
Owned For
Owner Type
Purchase Details
Closed on
May 22, 2006
Sold by
Gauthier Alice L and Gauthier Richard J
Bought by
Cordeiro Catherine A and Cordeiro Linda R
Current Estimated Value
Purchase Details
Closed on
Jun 28, 1995
Sold by
Boston Fed Sb
Bought by
Gauthier Richard J and Gauthier Alice L
Home Financials for this Owner
Home Financials are based on the most recent Mortgage that was taken out on this home.
Original Mortgage
$61,500
Interest Rate
7.8%
Mortgage Type
Purchase Money Mortgage
Purchase Details
Closed on
Feb 22, 1995
Sold by
Santos Luiz C
Bought by
Boston Federal Sb
Purchase Details
Closed on
Oct 24, 1990
Sold by
Boston Fed Sb
Bought by
Santos Luiz C
Home Financials for this Owner
Home Financials are based on the most recent Mortgage that was taken out on this home.
Original Mortgage
$71,100
Interest Rate
10.08%
Mortgage Type
Purchase Money Mortgage
Create a Home Valuation Report for This Property
The Home Valuation Report is an in-depth analysis detailing your home's value as well as a comparison with similar homes in the area
Home Values in the Area
Average Home Value in this Area
Purchase History
| Date | Buyer | Sale Price | Title Company |
|---|---|---|---|
| Cordeiro Catherine A | -- | -- | |
| Cordeiro Catherine A | -- | -- | |
| Gauthier Richard J | $65,000 | -- | |
| Gauthier Richard J | $65,000 | -- | |
| Boston Federal Sb | $50,000 | -- | |
| Boston Federal Sb | $50,000 | -- | |
| Santos Luiz C | $74,900 | -- | |
| Santos Luiz C | $74,900 | -- |
Source: Public Records
Mortgage History
| Date | Status | Borrower | Loan Amount |
|---|---|---|---|
| Previous Owner | Santos Luiz C | $61,500 | |
| Previous Owner | Santos Luiz C | $71,100 |
Source: Public Records
Tax History Compared to Growth
Tax History
| Year | Tax Paid | Tax Assessment Tax Assessment Total Assessment is a certain percentage of the fair market value that is determined by local assessors to be the total taxable value of land and additions on the property. | Land | Improvement |
|---|---|---|---|---|
| 2025 | $2,495 | $217,900 | $0 | $217,900 |
| 2024 | $2,439 | $212,300 | $0 | $212,300 |
| 2023 | $2,242 | $182,700 | $0 | $182,700 |
| 2022 | $2,015 | $159,700 | $0 | $159,700 |
| 2021 | $2,018 | $145,900 | $0 | $145,900 |
| 2020 | $2,019 | $139,700 | $0 | $139,700 |
| 2019 | $2,113 | $144,900 | $0 | $144,900 |
| 2018 | $1,857 | $127,000 | $0 | $127,000 |
| 2017 | $1,778 | $127,000 | $0 | $127,000 |
| 2016 | $1,683 | $123,500 | $0 | $123,500 |
| 2015 | $1,602 | $122,500 | $0 | $122,500 |
| 2014 | $1,654 | $131,500 | $0 | $131,500 |
Source: Public Records
Map
Nearby Homes
- 82 Wellington St
- 96 Wellington St
- 1556 N Main St Unit 7
- 1928 N Main St Unit 4
- 297 Lindsey St
- 302 Cory St
- 108 Stowe St Unit 108
- 110 Stowe St Unit 110
- 120 Stowe St Unit 120
- 122 Stowe St Unit 122
- 84 Cory St
- 195 Crescent St Unit 2
- 102 Vestal St
- 1000 Riverside Ave
- 100 Weetamoe St
- 131 Stewart St Unit 2
- 131 Stewart St Unit 3A
- 110 Weetamoe St
- 160 Stewart St
- 81 N Court St
- 200 Fulton St
- 200 Fulton St Unit 31
- 200 Fulton St Unit 30
- 200 Fulton St Unit 28
- 200 Fulton St Unit 26
- 200 Fulton St Unit 25
- 200 Fulton St Unit 24
- 200 Fulton St Unit 23
- 200 Fulton St Unit 22
- 200 Fulton St Unit 21
- 200 Fulton St Unit 20
- 200 Fulton St Unit 18
- 200 Fulton St Unit 17
- 200 Fulton St Unit 16
- 200 Fulton St Unit 15
- 200 Fulton St Unit 14
- 200 Fulton St Unit 13
- 200 Fulton St Unit 12
- 200 Fulton St Unit 11
- 200 Fulton St Unit 10