Estimated Value: $1,699,000 - $2,155,000
3
Beds
1
Bath
2,424
Sq Ft
$782/Sq Ft
Est. Value
About This Home
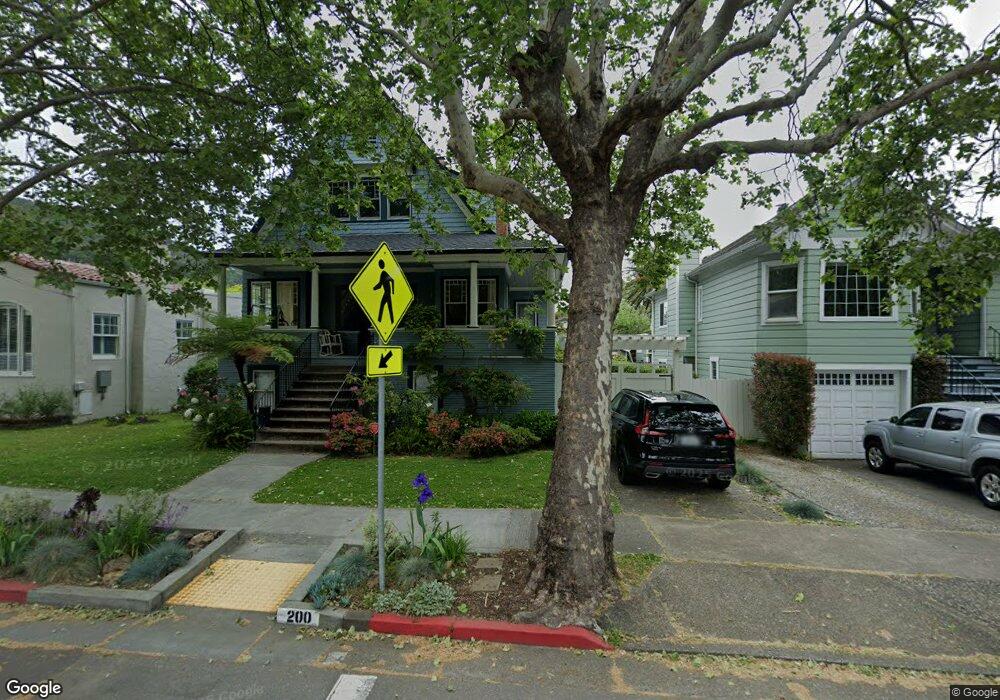
This home is located at 200 H St, San Rafael, CA 94901 and is currently estimated at $1,895,433, approximately $781 per square foot. 200 H St is a home located in Marin County with nearby schools including Sun Valley Elementary School, James B. Davidson Middle School, and San Rafael High School.
Ownership History
Date
Name
Owned For
Owner Type
Purchase Details
Closed on
Jan 27, 2020
Sold by
Brown Kenneth Paul and Brown Susan Guy
Bought by
Brown Kenneth Paul and Brown Susan Guy
Current Estimated Value
Home Financials for this Owner
Home Financials are based on the most recent Mortgage that was taken out on this home.
Original Mortgage
$309,000
Interest Rate
3.7%
Mortgage Type
New Conventional
Purchase Details
Closed on
Nov 18, 2013
Sold by
Brown Kenneth Paul and Brown Susan Porter Guy
Bought by
Brown Kenneth Paul and Brown Susan Guy
Create a Home Valuation Report for This Property
The Home Valuation Report is an in-depth analysis detailing your home's value as well as a comparison with similar homes in the area
Home Values in the Area
Average Home Value in this Area
Purchase History
| Date | Buyer | Sale Price | Title Company |
|---|---|---|---|
| Brown Kenneth Paul | -- | Wfg Title Company Of Ca | |
| Brown Kenneth Paul | -- | None Available |
Source: Public Records
Mortgage History
| Date | Status | Borrower | Loan Amount |
|---|---|---|---|
| Closed | Brown Kenneth Paul | $309,000 |
Source: Public Records
Tax History Compared to Growth
Tax History
| Year | Tax Paid | Tax Assessment Tax Assessment Total Assessment is a certain percentage of the fair market value that is determined by local assessors to be the total taxable value of land and additions on the property. | Land | Improvement |
|---|---|---|---|---|
| 2025 | $9,479 | $677,455 | $305,919 | $371,536 |
| 2024 | $9,479 | $664,173 | $299,921 | $364,252 |
| 2023 | $9,292 | $651,150 | $294,040 | $357,110 |
| 2022 | $8,795 | $638,383 | $288,275 | $350,108 |
| 2021 | $8,661 | $625,867 | $282,623 | $343,244 |
| 2020 | $8,507 | $609,454 | $279,727 | $329,727 |
| 2019 | $7,536 | $548,484 | $274,242 | $274,242 |
| 2018 | $7,475 | $537,732 | $268,866 | $268,866 |
| 2017 | $7,207 | $527,190 | $263,595 | $263,595 |
| 2016 | $7,359 | $516,854 | $258,427 | $258,427 |
| 2015 | $7,035 | $509,094 | $254,547 | $254,547 |
| 2014 | $6,734 | $499,122 | $249,561 | $249,561 |
Source: Public Records
Map
Nearby Homes