Estimated Value: $450,000 - $480,327
--
Bed
--
Bath
1,588
Sq Ft
$289/Sq Ft
Est. Value
About This Home
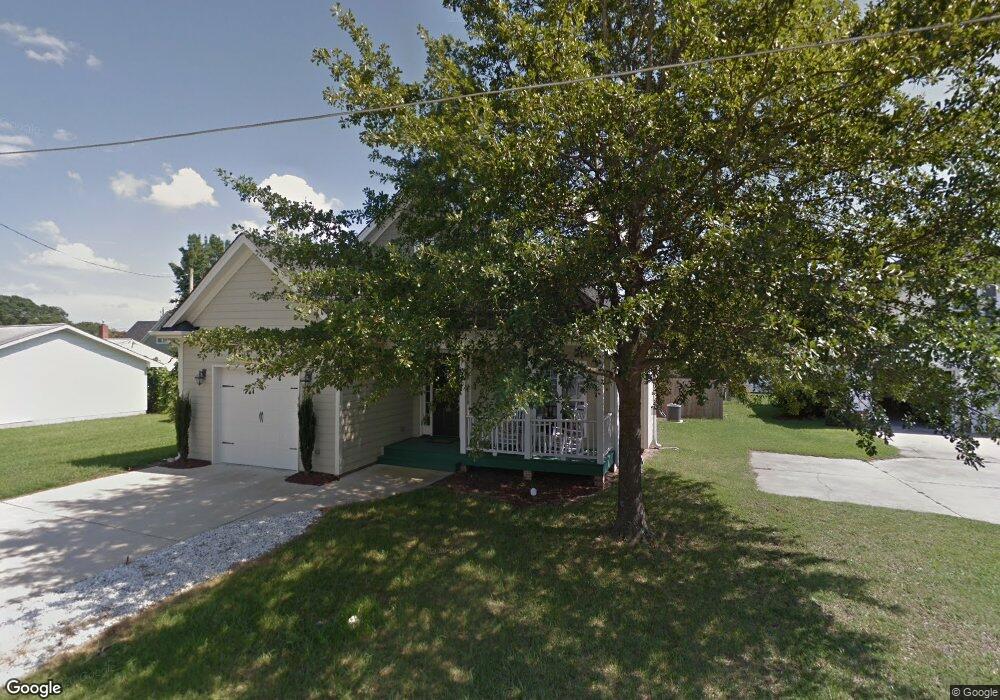
This home is located at 200 Herbert St Unit 1, Apex, NC 27502 and is currently estimated at $459,082, approximately $289 per square foot. 200 Herbert St Unit 1 is a home located in Wake County with nearby schools including Apex Elementary School, Apex Middle, and Apex High School.
Ownership History
Date
Name
Owned For
Owner Type
Purchase Details
Closed on
Dec 5, 2018
Sold by
Manseau Devin G
Bought by
Ansari Asif Saeed and Khan Tarannum
Current Estimated Value
Purchase Details
Closed on
Dec 4, 2018
Sold by
Manseau Devin G
Bought by
Ansari Asif Saeed and Khan Tarannum
Purchase Details
Closed on
Feb 25, 2015
Sold by
Levert Llc
Bought by
Manseau Devin G
Home Financials for this Owner
Home Financials are based on the most recent Mortgage that was taken out on this home.
Original Mortgage
$223,250
Interest Rate
3.77%
Mortgage Type
New Conventional
Purchase Details
Closed on
May 23, 2014
Sold by
South Ranch Llc
Bought by
Levert Llc
Create a Home Valuation Report for This Property
The Home Valuation Report is an in-depth analysis detailing your home's value as well as a comparison with similar homes in the area
Home Values in the Area
Average Home Value in this Area
Purchase History
| Date | Buyer | Sale Price | Title Company |
|---|---|---|---|
| Ansari Asif Saeed | $290,000 | None Listed On Document | |
| Ansari Asif Saeed | $290,000 | None Available | |
| Manseau Devin G | $235,000 | None Available | |
| Levert Llc | $125,000 | None Available |
Source: Public Records
Mortgage History
| Date | Status | Borrower | Loan Amount |
|---|---|---|---|
| Previous Owner | Manseau Devin G | $223,250 |
Source: Public Records
Tax History Compared to Growth
Tax History
| Year | Tax Paid | Tax Assessment Tax Assessment Total Assessment is a certain percentage of the fair market value that is determined by local assessors to be the total taxable value of land and additions on the property. | Land | Improvement |
|---|---|---|---|---|
| 2025 | $4,206 | $479,452 | $160,000 | $319,452 |
| 2024 | $4,112 | $479,452 | $160,000 | $319,452 |
| 2023 | $3,328 | $301,538 | $78,000 | $223,538 |
| 2022 | $3,124 | $301,538 | $78,000 | $223,538 |
| 2021 | $3,005 | $301,538 | $78,000 | $223,538 |
| 2020 | $2,975 | $301,538 | $78,000 | $223,538 |
| 2019 | $2,814 | $246,018 | $75,000 | $171,018 |
| 2018 | $2,651 | $246,018 | $75,000 | $171,018 |
| 2017 | $2,468 | $246,018 | $75,000 | $171,018 |
| 2016 | $2,432 | $246,018 | $75,000 | $171,018 |
| 2015 | $1,819 | $179,055 | $16,000 | $163,055 |
| 2014 | $155 | $16,000 | $16,000 | $0 |
Source: Public Records
Map
Nearby Homes
- 307 S Elm St
- 406 S Salem St
- 410 2nd St
- 318 Glaston Ct
- 1434 Salem Creek Dr
- 105 Cunningham St
- 202 W Chatham St
- 314 Wrenn St
- 311 Culvert St
- 309 Culvert St
- 1614 Brussels Dr
- 506 W Chatham St
- 1713 Yateley Ln
- 0-2932 Tingen Rd
- 1039 Dual Parks Rd
- 1004 Marston Ct
- 1104 Barrow Nook Ct
- 635 Sawcut Ln
- 631 Sawcut Ln
- 633 Sawcut Ln
- 200 Herbert St
- 290 Herbert St
- 201 Herbert St Unit 2
- 201 Herbert St
- 502 S Hughes St
- 175 Herbert St Unit 2
- 175 Herbert St
- 520 Germaine St
- 504 S Hughes St
- 508 S Hughes St
- 205 Herbert St
- 526 Germaine St
- 412 S Hughes St
- 408 S Hughes St
- 501 Germaine St
- 415 Herbert St
- 505 Germaine St
- 509 Germaine St
- 513 Germaine St
- 406 S Hughes St