Estimated Value: $272,000 - $295,599
3
Beds
3
Baths
1,942
Sq Ft
$147/Sq Ft
Est. Value
About This Home
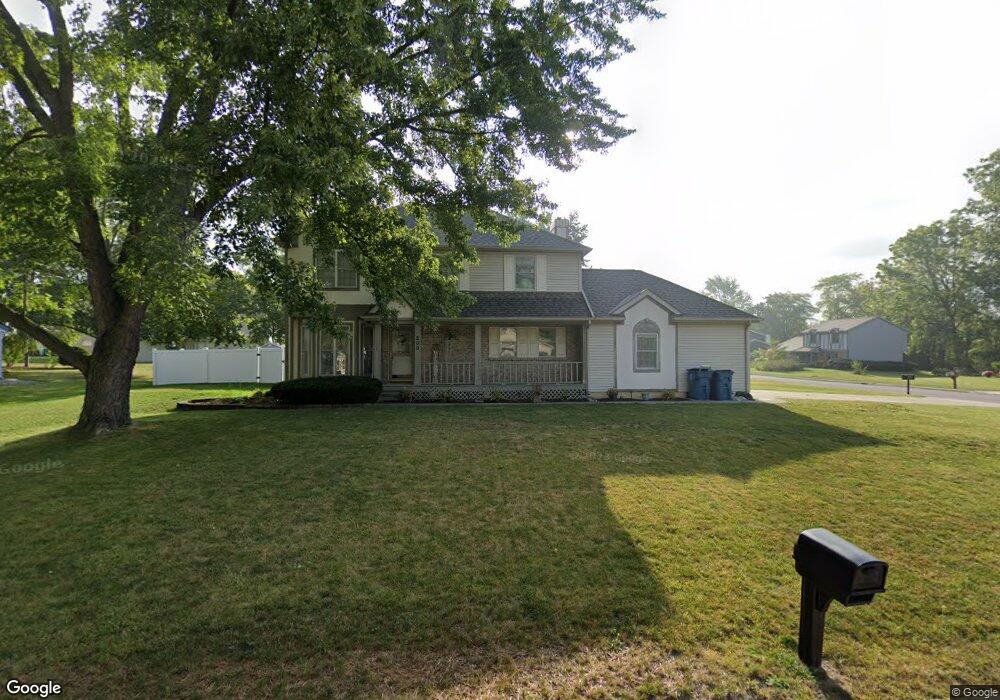
This home is located at 200 Illinois Dr, Bryan, OH 43506 and is currently estimated at $286,400, approximately $147 per square foot. 200 Illinois Dr is a home located in Williams County with nearby schools including Bryan Elementary PK-5, Washington Elementary School, and Bryan Middle School/High School.
Ownership History
Date
Name
Owned For
Owner Type
Purchase Details
Closed on
Sep 14, 2011
Sold by
Seaman Glen T and Seaman Therese M
Bought by
Mcdade Brent J and Mcdade Kelsey S
Current Estimated Value
Home Financials for this Owner
Home Financials are based on the most recent Mortgage that was taken out on this home.
Original Mortgage
$172,252
Outstanding Balance
$115,428
Interest Rate
4.12%
Mortgage Type
FHA
Estimated Equity
$170,972
Purchase Details
Closed on
Jul 25, 2003
Sold by
Marino Michael J and Marino Cassandra
Bought by
Cedant Mobility Financial Corporation and Seaman Therese M
Purchase Details
Closed on
Mar 21, 2001
Sold by
Hathaway Hathaway A A and Hathaway Linda L
Bought by
Marino Michael J and Marino Cassandra
Purchase Details
Closed on
Feb 16, 1999
Sold by
Herman Timothy J and Herman Margaret O
Bought by
Hathaway Hathaway A and Hathaway Linda L
Purchase Details
Closed on
May 28, 1996
Sold by
Bock Kevin C And
Bought by
Herman Timothy J and Herman Margaret O
Purchase Details
Closed on
Oct 1, 1993
Bought by
Bock Kevin C And
Create a Home Valuation Report for This Property
The Home Valuation Report is an in-depth analysis detailing your home's value as well as a comparison with similar homes in the area
Purchase History
| Date | Buyer | Sale Price | Title Company |
|---|---|---|---|
| Mcdade Brent J | $178,500 | None Available | |
| Cedant Mobility Financial Corporation | $189,000 | -- | |
| Marino Michael J | $183,000 | -- | |
| Hathaway Hathaway A | $181,500 | -- | |
| Herman Timothy J | $178,900 | -- | |
| Bock Kevin C And | $12,100 | -- |
Source: Public Records
Mortgage History
| Date | Status | Borrower | Loan Amount |
|---|---|---|---|
| Open | Mcdade Brent J | $172,252 |
Source: Public Records
Tax History
| Year | Tax Paid | Tax Assessment Tax Assessment Total Assessment is a certain percentage of the fair market value that is determined by local assessors to be the total taxable value of land and additions on the property. | Land | Improvement |
|---|---|---|---|---|
| 2025 | $3,885 | $87,400 | $12,920 | $74,480 |
| 2024 | $3,885 | $87,400 | $12,920 | $74,480 |
| 2023 | $3,923 | $71,410 | $13,270 | $58,140 |
| 2022 | $3,559 | $71,410 | $13,270 | $58,140 |
| 2021 | $3,559 | $71,410 | $13,270 | $58,140 |
| 2020 | $3,117 | $60,520 | $11,240 | $49,280 |
| 2019 | $3,095 | $60,520 | $11,240 | $49,280 |
| 2018 | $3,090 | $60,520 | $11,240 | $49,280 |
| 2017 | $2,890 | $56,950 | $11,240 | $45,710 |
| 2016 | $2,761 | $56,950 | $11,240 | $45,710 |
| 2015 | $2,887 | $56,950 | $11,240 | $45,710 |
| 2014 | $2,887 | $56,950 | $11,240 | $45,710 |
| 2013 | $2,891 | $56,950 | $11,240 | $45,710 |
Source: Public Records
Map
Nearby Homes
- 205 Indiana Dr
- 206 Brown Dr
- 13673 County Rd E
- 144 Deerfield Cir
- 723 W High St
- 228 N Beech St
- 000 C R C (West 828)
- 000 C R C (East 787)
- 0 Lynn St Unit 6110702
- 412 Center St
- 1001 Greystone Dr
- 630 Center Ridge Rd
- 0 Whetstone Unit 10004370
- 319 N Williams St
- 315 N Williams St
- 542 S Beech St
- 422 S Main St
- 216 N Allen St
- 330 N Emmett St
- 6695 Ohio 15
- 204 Illinois Dr
- 201 Michigan Dr
- 203 Michigan Dr
- 314 Norlick Dr
- 201 Illinois Dr
- 318 Norlick Dr
- 206 Illinois Dr
- 203 Illinois Dr
- 310 Norlick Dr
- 205 Michigan Dr
- 322 Norlick Dr
- 205 Illinois Dr
- 306 Norlick Dr
- 200 Michigan Dr
- 325 Norlick Dr
- 204 Michigan Dr
- 208 Illinois Dr
- 228 Illinois Dr
- 207 Michigan Dr
- 206 Michigan Dr
Your Personal Tour Guide
Ask me questions while you tour the home.