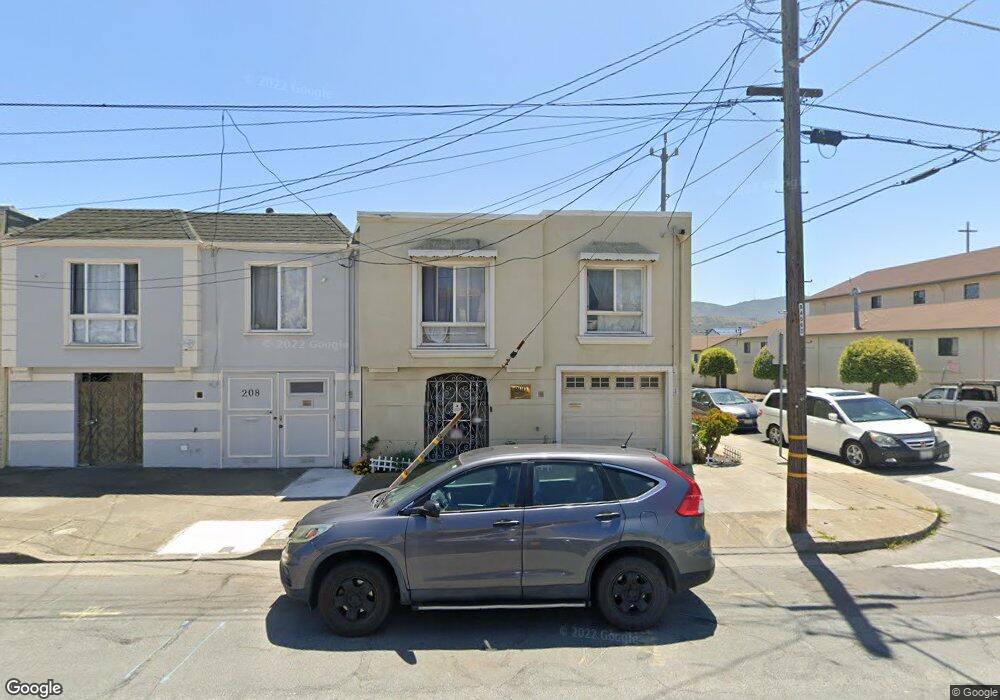
200 Lathrop Ave San Francisco, CA 94134
Little Hollywood NeighborhoodEstimated Value: $760,000 - $1,277,000
2
Beds
1
Bath
800
Sq Ft
$1,363/Sq Ft
Est. Value
About This Home
This home is located at 200 Lathrop Ave, San Francisco, CA 94134 and is currently estimated at $1,090,684, approximately $1,363 per square foot. 200 Lathrop Ave is a home located in San Francisco County with nearby schools including El Dorado Elementary School, Visitacion Valley Middle School, and KIPP Bayview Academy.
Ownership History
Date
Name
Owned For
Owner Type
Purchase Details
Closed on
Apr 1, 2017
Sold by
Warden Trang and Warden Trang Nguyen
Bought by
Warden Christopher F and Warden Trang
Current Estimated Value
Purchase Details
Closed on
Jan 23, 2008
Sold by
Warden Christopher Fairbanks
Bought by
Warden Trang Nguyen
Home Financials for this Owner
Home Financials are based on the most recent Mortgage that was taken out on this home.
Original Mortgage
$281,000
Outstanding Balance
$177,465
Interest Rate
6.17%
Mortgage Type
Purchase Money Mortgage
Estimated Equity
$913,219
Purchase Details
Closed on
Jul 30, 2002
Sold by
Judnick Kenneth
Bought by
Nguyen Duy and Nguyen Nhu Trang Vy
Home Financials for this Owner
Home Financials are based on the most recent Mortgage that was taken out on this home.
Original Mortgage
$292,000
Interest Rate
6.6%
Mortgage Type
Stand Alone First
Purchase Details
Closed on
Apr 11, 2002
Sold by
Madronich Bernadine
Bought by
Judnick Kenneth
Create a Home Valuation Report for This Property
The Home Valuation Report is an in-depth analysis detailing your home's value as well as a comparison with similar homes in the area
Home Values in the Area
Average Home Value in this Area
Purchase History
| Date | Buyer | Sale Price | Title Company |
|---|---|---|---|
| Warden Christopher F | -- | None Available | |
| Warden Trang Nguyen | -- | Chicago Title Company | |
| Warden Trang Nguyen | -- | Chicago Title Company | |
| Nguyen Duy | $365,000 | Chicago Title Co | |
| Judnick Kenneth | -- | -- |
Source: Public Records
Mortgage History
| Date | Status | Borrower | Loan Amount |
|---|---|---|---|
| Open | Warden Trang Nguyen | $281,000 | |
| Closed | Warden Trang Nguyen | $281,000 | |
| Closed | Nguyen Duy | $292,000 |
Source: Public Records
Tax History Compared to Growth
Tax History
| Year | Tax Paid | Tax Assessment Tax Assessment Total Assessment is a certain percentage of the fair market value that is determined by local assessors to be the total taxable value of land and additions on the property. | Land | Improvement |
|---|---|---|---|---|
| 2025 | $12,942 | $1,048,864 | $417,676 | $631,188 |
| 2024 | $12,942 | $1,028,304 | $409,488 | $618,816 |
| 2023 | $12,699 | $1,008,144 | $401,460 | $606,684 |
| 2022 | $12,376 | $982,500 | $393,590 | $588,910 |
| 2021 | $12,098 | $958,336 | $385,874 | $572,462 |
| 2020 | $12,198 | $947,524 | $381,918 | $565,606 |
| 2019 | $11,785 | $928,948 | $374,430 | $554,518 |
| 2018 | $11,387 | $910,736 | $367,090 | $543,646 |
| 2017 | $10,110 | $820,705 | $316,589 | $504,116 |
| 2016 | $9,932 | $804,614 | $310,382 | $494,232 |
| 2015 | $7,954 | $635,846 | $305,721 | $330,125 |
| 2014 | $7,747 | $623,393 | $299,734 | $323,659 |
Source: Public Records
Map
Nearby Homes
- 219 Wheeler Ave
- 3630 San Bruno Ave
- 137 Arleta Ave
- 121 Diamond Cove Terrace
- 73 Tioga Ave
- 38 Jennings Ct Unit 38
- 291 Raymond Ave
- 771 Delta St
- 435 Wilde Ave
- 1 Crescent Way Unit 1402
- 1081 Goettingen St
- 420 Harkness Ave
- 101 Crescent Way Unit 2312
- 248 Ordway St
- 501 Crescent Way Unit 5407
- 301 Crescent Ct Unit 3214
- 301 Crescent Ct Unit 3107
- 301 Crescent Ct Unit 3101
- 6323-6325 3rd St
- 401 Crescent Ct Unit 4401
- 208 Lathrop Ave
- 214 Lathrop Ave
- 425 Wheeler Ave
- 220 Lathrop Ave
- 433 Wheeler Ave
- 439 Wheeler Ave
- 333 Tunnel Ave
- 375 Wheeler Ave
- 410 Peninsula Ave
- 416 Peninsula Ave
- 400 Peninsula Ave
- 445 Wheeler Ave
- 422 Peninsula Ave
- 430 Peninsula Ave
- 367 Wheeler Ave
- 451 Wheeler Ave
- 362 Wheeler Ave
- 112 Lathrop Ave
- 436 Peninsula Ave
- 360 Peninsula Ave