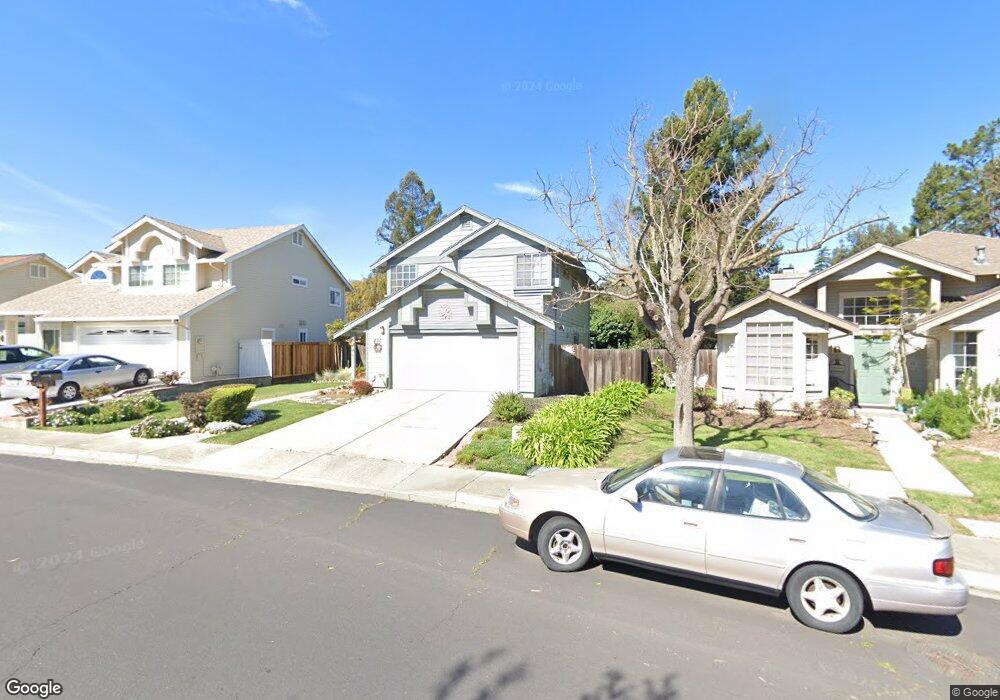
200 Longridge Dr Vallejo, CA 94591
Estimated Value: $531,868 - $623,000
3
Beds
3
Baths
1,475
Sq Ft
$388/Sq Ft
Est. Value
About This Home
This home is located at 200 Longridge Dr, Vallejo, CA 94591 and is currently estimated at $572,967, approximately $388 per square foot. 200 Longridge Dr is a home located in Solano County with nearby schools including Annie Pennycook Elementary School, Jesse M. Bethel High School, and Vallejo Charter School.
Ownership History
Date
Name
Owned For
Owner Type
Purchase Details
Closed on
Jan 5, 2012
Sold by
Gmac Mortgage Llc
Bought by
Conner Charles D and Zaki Maurya Pat
Current Estimated Value
Purchase Details
Closed on
Aug 12, 2011
Sold by
Pesi Kiliona and Vitale Mui
Bought by
Gmac Mortgage Llc
Purchase Details
Closed on
Dec 23, 1996
Sold by
Ester Johnson Maud
Bought by
Pesi Kiliona and Vitale Mui
Home Financials for this Owner
Home Financials are based on the most recent Mortgage that was taken out on this home.
Original Mortgage
$155,040
Interest Rate
7.59%
Mortgage Type
VA
Purchase Details
Closed on
Aug 16, 1995
Sold by
Johnson Maud Ester
Bought by
Johnson Maud Ester
Home Financials for this Owner
Home Financials are based on the most recent Mortgage that was taken out on this home.
Original Mortgage
$35,100
Interest Rate
7.71%
Create a Home Valuation Report for This Property
The Home Valuation Report is an in-depth analysis detailing your home's value as well as a comparison with similar homes in the area
Purchase History
| Date | Buyer | Sale Price | Title Company |
|---|---|---|---|
| Conner Charles D | $141,000 | First American Title Company | |
| Gmac Mortgage Llc | $153,000 | Accommodation | |
| Pesi Kiliona | $152,000 | Fidelity National Title Co | |
| Johnson Maud Ester | -- | Fidelity National Title |
Source: Public Records
Mortgage History
| Date | Status | Borrower | Loan Amount |
|---|---|---|---|
| Previous Owner | Pesi Kiliona | $155,040 | |
| Previous Owner | Johnson Maud Ester | $35,100 |
Source: Public Records
Tax History Compared to Growth
Tax History
| Year | Tax Paid | Tax Assessment Tax Assessment Total Assessment is a certain percentage of the fair market value that is determined by local assessors to be the total taxable value of land and additions on the property. | Land | Improvement |
|---|---|---|---|---|
| 2025 | $3,092 | $176,964 | $50,233 | $126,731 |
| 2024 | $3,092 | $173,496 | $49,249 | $124,247 |
| 2023 | $2,883 | $170,095 | $48,284 | $121,811 |
| 2022 | $2,779 | $166,761 | $47,339 | $119,422 |
| 2021 | $2,717 | $163,492 | $46,411 | $117,081 |
| 2020 | $2,714 | $161,817 | $45,936 | $115,881 |
| 2019 | $2,617 | $158,645 | $45,036 | $113,609 |
| 2018 | $2,441 | $155,535 | $44,153 | $111,382 |
| 2017 | $2,318 | $152,487 | $43,288 | $109,199 |
| 2016 | $1,748 | $149,498 | $42,440 | $107,058 |
| 2015 | $1,725 | $147,253 | $41,803 | $105,450 |
| 2014 | $1,702 | $144,370 | $40,985 | $103,385 |
Source: Public Records
Map
Nearby Homes
- 709 Pope Dr
- 125 Easson Ct
- 1207 1 2 Warren Ave
- 150 Yorkshire Ct
- 118 Hydrangea Ct
- 112 Dyer Ct
- 1161 Benicia Rd Unit 11
- 1161 Benicia Rd Unit SPC 18
- 1337 Shea Terrace
- 257 Valley Oak Ln
- 112 Aragon Ct
- 256 Honeydew Dr
- 1146 Lewis Ave
- 235 Toledo Ct
- 1259 Fulton Ave
- 479 Aragon St
- 210 Baywood Dr
- 7283 Abbey Dr
- 4118 Georgia St
- 8601 Rockaway Dr
- 164 Longridge Dr
- 216 Longridge Dr
- 132 Longridge Dr
- 232 Longridge Dr
- 100 Crownpointe Dr
- 248 Longridge Dr
- 101 Crownpointe Dr
- 104 Crownpointe Dr
- 264 Longridge Dr
- 105 Crownpointe Dr
- 280 Longridge Dr
- 109 Crownpointe Dr
- 112 Crownpointe Dr
- 113 Crownpointe Dr
- 285 Longridge Dr
- 136 Crownpointe Dr
- 101 Sunnyglen Dr
- 148 Crownpointe Dr
- 105 Sunnyglen Dr