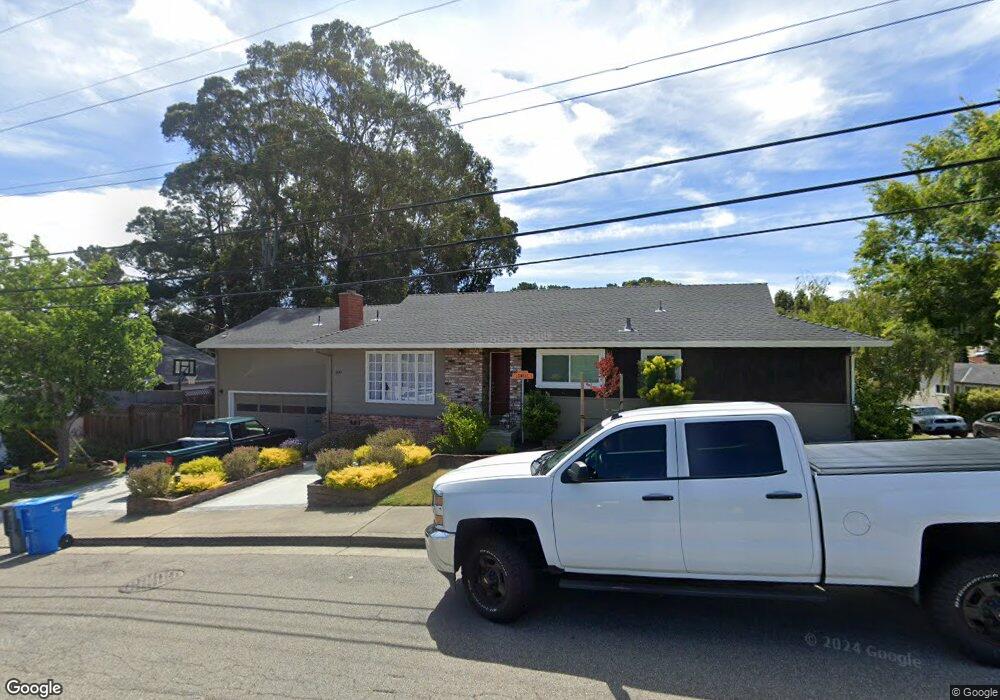
200 Lowell Ave San Bruno, CA 94066
Crestmoor NeighborhoodEstimated Value: $1,491,000 - $2,021,000
4
Beds
2
Baths
1,850
Sq Ft
$975/Sq Ft
Est. Value
About This Home
This home is located at 200 Lowell Ave, San Bruno, CA 94066 and is currently estimated at $1,804,299, approximately $975 per square foot. 200 Lowell Ave is a home located in San Mateo County with nearby schools including John Muir Elementary School, Parkside Intermediate School, and Capuchino High School.
Ownership History
Date
Name
Owned For
Owner Type
Purchase Details
Closed on
Jul 20, 2016
Sold by
Mahoney Jeremiah and Mahoney Susan
Bought by
Zayac Scott and Zayac Jacqueline
Current Estimated Value
Home Financials for this Owner
Home Financials are based on the most recent Mortgage that was taken out on this home.
Original Mortgage
$500,000
Outstanding Balance
$389,763
Interest Rate
2.87%
Mortgage Type
Adjustable Rate Mortgage/ARM
Estimated Equity
$1,414,536
Purchase Details
Closed on
Jun 1, 2015
Sold by
Mahoney Jeremiah and Mahoney Susan
Bought by
Mahoney Jeremiah and Mahoney Susan
Purchase Details
Closed on
Dec 21, 2010
Sold by
Maza Steven M and Maza Stephanie
Bought by
Mahoney Jeremiah and Mahoney Susan
Home Financials for this Owner
Home Financials are based on the most recent Mortgage that was taken out on this home.
Original Mortgage
$510,000
Interest Rate
4.17%
Mortgage Type
New Conventional
Purchase Details
Closed on
Jan 22, 2002
Sold by
Barbieri John Guy and Barbieri Sheri Lynn
Bought by
Maza Steven M and Maza Stephanie
Home Financials for this Owner
Home Financials are based on the most recent Mortgage that was taken out on this home.
Original Mortgage
$525,000
Interest Rate
7.15%
Mortgage Type
Stand Alone First
Create a Home Valuation Report for This Property
The Home Valuation Report is an in-depth analysis detailing your home's value as well as a comparison with similar homes in the area
Home Values in the Area
Average Home Value in this Area
Purchase History
| Date | Buyer | Sale Price | Title Company |
|---|---|---|---|
| Zayac Scott | $250,000 | First American Title Company | |
| Mahoney Jeremiah | $425,000 | Stewart Title Of Ca Inc | |
| Mahoney Jeremiah | $680,000 | Fidelity National Title Co | |
| Maza Steven M | $580,000 | First American Title Co |
Source: Public Records
Mortgage History
| Date | Status | Borrower | Loan Amount |
|---|---|---|---|
| Open | Zayac Scott | $500,000 | |
| Closed | Mahoney Jeremiah | $510,000 | |
| Previous Owner | Maza Steven M | $525,000 |
Source: Public Records
Tax History Compared to Growth
Tax History
| Year | Tax Paid | Tax Assessment Tax Assessment Total Assessment is a certain percentage of the fair market value that is determined by local assessors to be the total taxable value of land and additions on the property. | Land | Improvement |
|---|---|---|---|---|
| 2025 | $11,707 | $871,188 | $435,594 | $435,594 |
| 2023 | $11,707 | $837,360 | $418,680 | $418,680 |
| 2022 | $9,137 | $820,942 | $410,471 | $410,471 |
| 2021 | $9,020 | $804,846 | $402,423 | $402,423 |
| 2020 | $8,936 | $796,594 | $398,297 | $398,297 |
| 2019 | $8,790 | $780,976 | $390,488 | $390,488 |
| 2018 | $8,354 | $765,664 | $382,832 | $382,832 |
| 2017 | $8,265 | $750,652 | $375,326 | $375,326 |
| 2016 | $8,099 | $735,934 | $367,967 | $367,967 |
| 2015 | $7,992 | $724,880 | $362,440 | $362,440 |
| 2014 | $7,876 | $710,682 | $355,341 | $355,341 |
Source: Public Records
Map
Nearby Homes
- 2405 Whitman Way
- 2641 Ridgeway Ave
- 2340 Princeton Dr
- 8124 Shelter Creek Ln
- 4359 Shelter Creek Ln Unit 4359
- 4222 Shelter Creek Ln Unit 4222
- 2149 Shelter Creek Ln
- 5223 Shelter Creek Ln Unit 5223
- 8150 Shelter Creek Ln
- 2150 Shelter Creek Ln Unit 2150
- 5344 Shelter Creek Ln
- 7142 Shelter Creek Ln
- 8227 Shelter Creek Ln
- 5202 Shelter Creek Ln
- 1385 Terrace Dr
- 2555 Crestmoor Dr
- 2425 Crestmoor Dr
- 579 Hawthorne Ave
- 532 Cedar Ave
- 752 Cherry Ave
- 2340 Bennington Dr
- 220 Lowell Ave
- 2330 Bennington Dr
- 230 Lowell Ave
- 2380 Bennington Dr
- 211 Lowell Ave
- 2361 Bennington Dr
- 2351 Bennington Dr
- 2320 Bennington Dr
- 2371 Bennington Dr
- 221 Lowell Ave
- 2341 Bennington Dr
- 250 Lowell Ave
- 2381 Bennington Dr
- 2331 Bennington Dr
- 251 Lowell Ave
- 2310 Bennington Dr
- 2391 Bennington Dr
- 191 Madison Ave
- 270 Lowell Ave