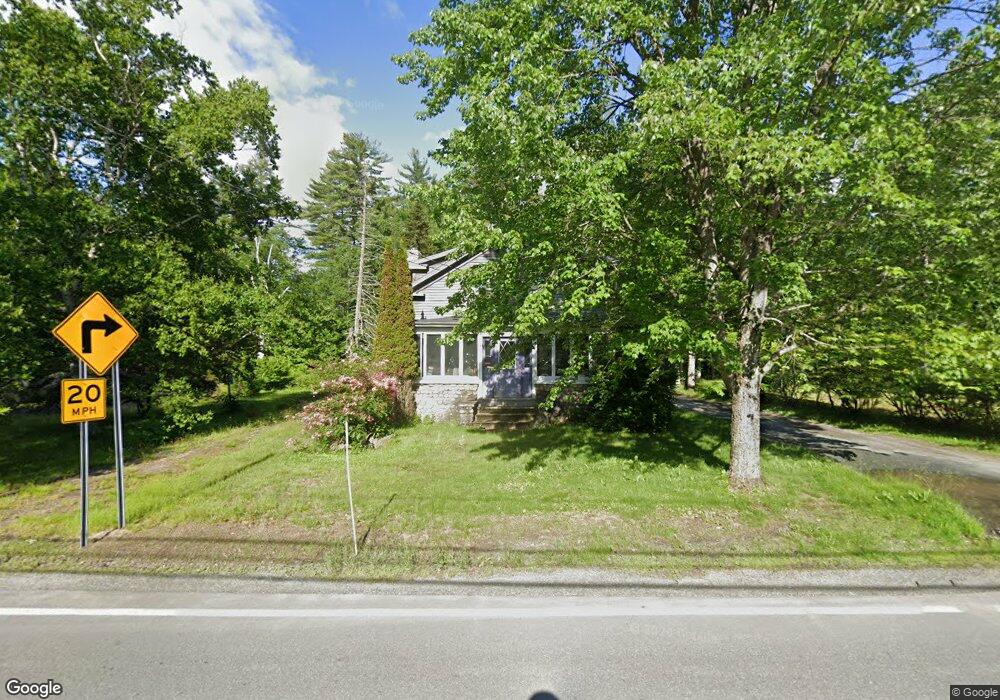
200 Maple St Bethlehem, NH 03574
Estimated Value: $369,000 - $488,000
5
Beds
3
Baths
2,322
Sq Ft
$182/Sq Ft
Est. Value
About This Home
This home is located at 200 Maple St, Bethlehem, NH 03574 and is currently estimated at $422,292, approximately $181 per square foot. 200 Maple St is a home located in Grafton County with nearby schools including Bethlehem Elementary School, Profile Junior High School, and Profile Senior High School.
Ownership History
Date
Name
Owned For
Owner Type
Purchase Details
Closed on
Sep 15, 2005
Sold by
Yvette F Macbain T
Bought by
Williams Christopher M and Williams Sandra L
Current Estimated Value
Home Financials for this Owner
Home Financials are based on the most recent Mortgage that was taken out on this home.
Original Mortgage
$188,875
Outstanding Balance
$40,055
Interest Rate
5.84%
Estimated Equity
$382,237
Create a Home Valuation Report for This Property
The Home Valuation Report is an in-depth analysis detailing your home's value as well as a comparison with similar homes in the area
Home Values in the Area
Average Home Value in this Area
Purchase History
| Date | Buyer | Sale Price | Title Company |
|---|---|---|---|
| Williams Christopher M | $184,900 | -- | |
| Williams Christopher M | $184,900 | -- |
Source: Public Records
Mortgage History
| Date | Status | Borrower | Loan Amount |
|---|---|---|---|
| Open | Williams Christopher M | $188,875 | |
| Closed | Williams Christopher M | $188,875 |
Source: Public Records
Tax History
| Year | Tax Paid | Tax Assessment Tax Assessment Total Assessment is a certain percentage of the fair market value that is determined by local assessors to be the total taxable value of land and additions on the property. | Land | Improvement |
|---|---|---|---|---|
| 2024 | $6,195 | $360,600 | $83,900 | $276,700 |
| 2023 | $5,564 | $360,600 | $83,900 | $276,700 |
| 2022 | $4,042 | $169,200 | $26,400 | $142,800 |
| 2021 | $4,289 | $173,000 | $26,400 | $146,600 |
| 2020 | $4,360 | $173,000 | $26,400 | $146,600 |
| 2019 | $4,624 | $173,000 | $26,400 | $146,600 |
| 2018 | $4,493 | $173,000 | $26,400 | $146,600 |
| 2017 | $3,772 | $122,800 | $28,900 | $93,900 |
| 2016 | $3,372 | $122,800 | $28,900 | $93,900 |
| 2015 | $3,637 | $122,800 | $28,900 | $93,900 |
| 2013 | $3,506 | $122,800 | $28,900 | $93,900 |
Source: Public Records
Map
Nearby Homes
- 42 Maple St
- 16 3rd St
- 15 Okane Ave
- 28 Jodo Way
- 7 James St
- 2480 Main St
- O Main St
- 206 Lewis Hill Rd
- 105 Alpenhof Rd
- 264 Wing Rd
- 1 Agassiz St
- 961 Maple St
- 000 Ridge Rd Unit 28
- 686 Wing Rd
- 00 Ridge Rd Unit 27
- 103 River Rd
- 0 Thorn Hill Rd Unit 22 5063258
- 61 Thorn Hill Rd
- 99 Whitefield Rd
- 191 Washington St
Your Personal Tour Guide
Ask me questions while you tour the home.