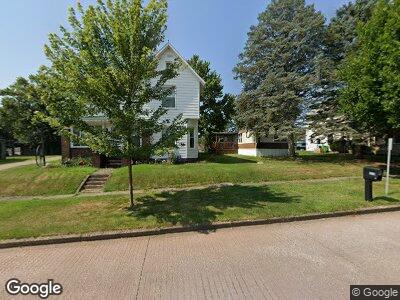
200 Maple St SW Sugarcreek, OH 44681
Estimated Value: $180,000 - $215,000
3
Beds
1
Bath
1,728
Sq Ft
$116/Sq Ft
Est. Value
About This Home
This home is located at 200 Maple St SW, Sugarcreek, OH 44681 and is currently estimated at $199,635, approximately $115 per square foot. 200 Maple St SW is a home located in Tuscarawas County with nearby schools including Garaway High School, Genza Bottom, and OAK RIDGE SCHOOL.
Ownership History
Date
Name
Owned For
Owner Type
Purchase Details
Closed on
Apr 28, 2025
Sold by
Arlene M Sigrist Family Irrevocable Trus and Sundheimer Gloria J
Bought by
Sundheimer Jeremy M
Current Estimated Value
Home Financials for this Owner
Home Financials are based on the most recent Mortgage that was taken out on this home.
Original Mortgage
$140,000
Outstanding Balance
$140,000
Interest Rate
6.5%
Mortgage Type
New Conventional
Estimated Equity
$59,635
Purchase Details
Closed on
Sep 30, 2016
Sold by
Sigrist Arlene M
Bought by
Sundheimer Gloria J and Morgan Donna D
Purchase Details
Closed on
Jun 11, 2015
Sold by
Sigrist James Edgar and Sigrist Arlene Mary
Bought by
Sigrist James E and Sigrist Arlene M
Create a Home Valuation Report for This Property
The Home Valuation Report is an in-depth analysis detailing your home's value as well as a comparison with similar homes in the area
Home Values in the Area
Average Home Value in this Area
Purchase History
| Date | Buyer | Sale Price | Title Company |
|---|---|---|---|
| Sundheimer Jeremy M | -- | None Listed On Document | |
| Sundheimer Jeremy M | -- | None Listed On Document | |
| Sundheimer Gloria J | -- | None Available | |
| Sigrist James E | -- | None Available |
Source: Public Records
Mortgage History
| Date | Status | Borrower | Loan Amount |
|---|---|---|---|
| Open | Sundheimer Jeremy M | $140,000 | |
| Closed | Sundheimer Jeremy M | $140,000 | |
| Previous Owner | Sigrist James Edgar | $66,500 | |
| Previous Owner | Sigrist James E | $2,679 |
Source: Public Records
Tax History Compared to Growth
Tax History
| Year | Tax Paid | Tax Assessment Tax Assessment Total Assessment is a certain percentage of the fair market value that is determined by local assessors to be the total taxable value of land and additions on the property. | Land | Improvement |
|---|---|---|---|---|
| 2024 | $1,392 | $129,940 | $31,500 | $98,440 |
| 2023 | $1,392 | $129,940 | $31,500 | $98,440 |
| 2022 | $1,447 | $45,479 | $11,025 | $34,454 |
| 2021 | $1,145 | $35,991 | $10,889 | $25,102 |
| 2020 | $1,148 | $35,991 | $10,889 | $25,102 |
| 2019 | $1,154 | $35,991 | $10,889 | $25,102 |
| 2018 | $873 | $15,730 | $9,190 | $6,540 |
| 2017 | $286 | $15,730 | $9,190 | $6,540 |
| 2016 | $824 | $29,250 | $9,190 | $20,060 |
| 2014 | $805 | $28,470 | $8,560 | $19,910 |
| 2013 | $754 | $28,470 | $8,560 | $19,910 |
Source: Public Records
Map
Nearby Homes
- 131 Maple St SW
- 221 5th St SW
- 232 Church St SW
- 163 Heritage Crossing SE
- 9659 Yoder Rd SW
- 0 Cherry Ridge Dr SW Unit 5106181
- 0 Yoder Rd SW
- 186 Pleasant Valley Rd SW
- 0 Winklepleck Rd NW
- 3004 Winklepleck Rd NW
- 3860 Township Road 162
- 3850 Township Road 162
- 5467 Old Route 39 NW
- 3153 Boltz Orchard Rd SW
- 4991 Walnut St
- 127 Buena Vista St
- 125 Buena Vista St
- 0 Hilltop Rd Unit 5119979
- 0 Hilltop Rd Unit 5119982
- 0 Hilltop Rd Unit 5119977
- 200 Maple St SW
- 126 Maple St SW
- 208 Maple St SW
- 203 Oak St SW
- 135 Maple St SW
- 218 Maple St SW
- 221 Oak St SW
- 205 Maple St SW
- 217 Oak St SW
- 209 Maple St SW
- 120 Finzer Dr SW
- 213 Maple St SW
- 213 Maple St SW
- 125 Maple St SW
- 214 S Broadway St
- 212 S Broadway St
- 121 Maple St SW
- 229 3rd St SW
- 230 S Broadway St
- 223 Maple St SW