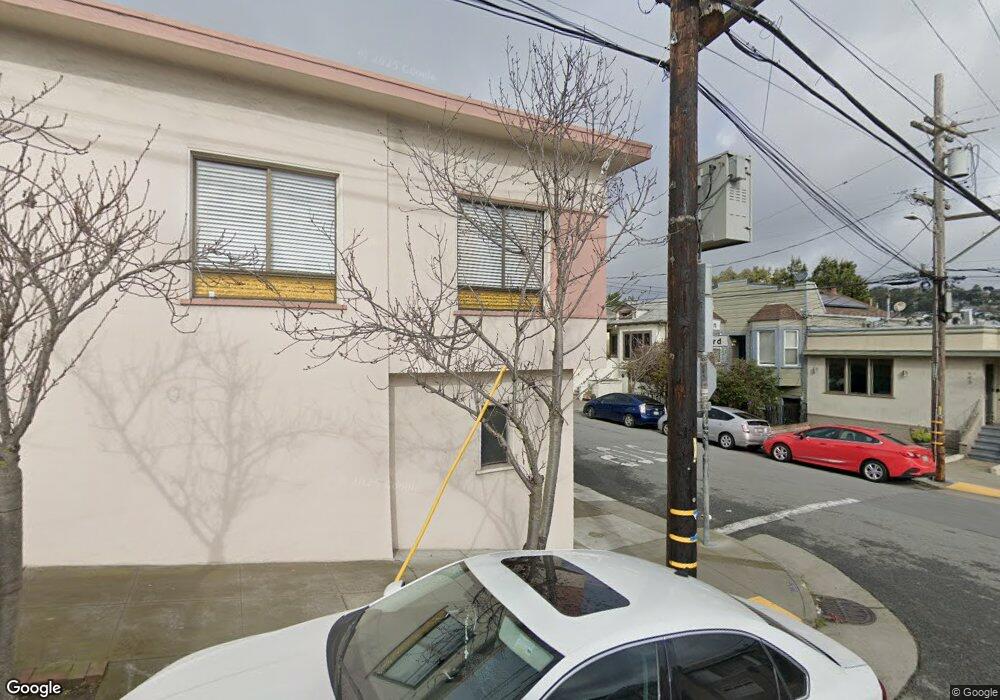
200 Maynard St San Francisco, CA 94112
Excelsior NeighborhoodEstimated Value: $965,000 - $1,310,000
--
Bed
1
Bath
1,466
Sq Ft
$752/Sq Ft
Est. Value
About This Home
This home is located at 200 Maynard St, San Francisco, CA 94112 and is currently estimated at $1,102,862, approximately $752 per square foot. 200 Maynard St is a home located in San Francisco County with nearby schools including Hillcrest Elementary School, King Jr. (Martin Luther) Academic Middle School, and Cornerstone Academy.
Ownership History
Date
Name
Owned For
Owner Type
Purchase Details
Closed on
Sep 21, 2017
Sold by
Ondry Sharon Ann
Bought by
Ondry Steven Carl and Ondry Sharon Ann
Current Estimated Value
Purchase Details
Closed on
Aug 8, 2017
Sold by
Ondry Sharon Ann
Bought by
Ondry Sharon Ann
Purchase Details
Closed on
Sep 27, 2011
Sold by
Delgrosso Guido J
Bought by
Delgrosso Guido J
Purchase Details
Closed on
Nov 10, 2008
Sold by
Spediacci Jeanne M
Bought by
Spediacci Jeanne M
Purchase Details
Closed on
Oct 9, 2002
Sold by
Delgrosso Guido J and Delgrosso Delia A
Bought by
Delgrosso Guido J and Delgrosso Delia A
Purchase Details
Closed on
Feb 23, 2000
Sold by
Spediacci Albert P and Delia Del Grosso
Bought by
Spediacci Albert and Spediacci Jeanne
Home Financials for this Owner
Home Financials are based on the most recent Mortgage that was taken out on this home.
Original Mortgage
$120,000
Interest Rate
8.16%
Purchase Details
Closed on
Jun 30, 1999
Sold by
Ragni Louis
Bought by
Ragni Louis
Create a Home Valuation Report for This Property
The Home Valuation Report is an in-depth analysis detailing your home's value as well as a comparison with similar homes in the area
Home Values in the Area
Average Home Value in this Area
Purchase History
| Date | Buyer | Sale Price | Title Company |
|---|---|---|---|
| Ondry Steven Carl | -- | None Available | |
| Ondry Sharon Ann | -- | None Available | |
| Delgrosso Guido J | -- | None Available | |
| Spediacci Jeanne M | -- | None Available | |
| Delgrosso Guido J | -- | -- | |
| Delgrosso Guido J | -- | -- | |
| Spediacci Albert | $112,000 | Fidelity National Title Co | |
| Ragni Louis | -- | -- |
Source: Public Records
Mortgage History
| Date | Status | Borrower | Loan Amount |
|---|---|---|---|
| Closed | Spediacci Albert | $120,000 |
Source: Public Records
Tax History Compared to Growth
Tax History
| Year | Tax Paid | Tax Assessment Tax Assessment Total Assessment is a certain percentage of the fair market value that is determined by local assessors to be the total taxable value of land and additions on the property. | Land | Improvement |
|---|---|---|---|---|
| 2025 | $3,906 | $271,409 | $119,387 | $152,022 |
| 2024 | $3,906 | $266,091 | $117,048 | $149,043 |
| 2023 | $3,838 | $260,876 | $114,754 | $146,122 |
| 2022 | $3,750 | $255,763 | $112,505 | $143,258 |
| 2021 | $3,679 | $250,751 | $110,301 | $140,450 |
| 2020 | $3,765 | $248,183 | $109,172 | $139,011 |
| 2019 | $3,592 | $243,320 | $107,033 | $136,287 |
| 2018 | $3,472 | $238,522 | $104,921 | $133,601 |
| 2017 | $3,133 | $233,848 | $102,865 | $130,983 |
| 2016 | $3,056 | $229,266 | $100,849 | $128,417 |
| 2015 | $3,016 | $225,826 | $99,336 | $126,490 |
| 2014 | $2,938 | $221,405 | $97,391 | $124,014 |
Source: Public Records
Map
Nearby Homes
- 201 Congdon St
- 87 Maynard St
- 106 Madrid St
- 44 Maynard St
- 447 Justin Dr
- 4039-4041 Mission St
- 35 Admiral Ave
- 71 Gladstone Dr
- 126-128 Lisbon St
- 263 Vienna St
- 270 Athens St
- 70 Justin Dr
- 366 Harvard St
- 310 Excelsior Ave
- 30 Cotter St
- 200 Cayuga Ave
- 78 Theresa St
- 251 Lisbon St
- 125 Leese St
- 474 Arlington St Unit 478