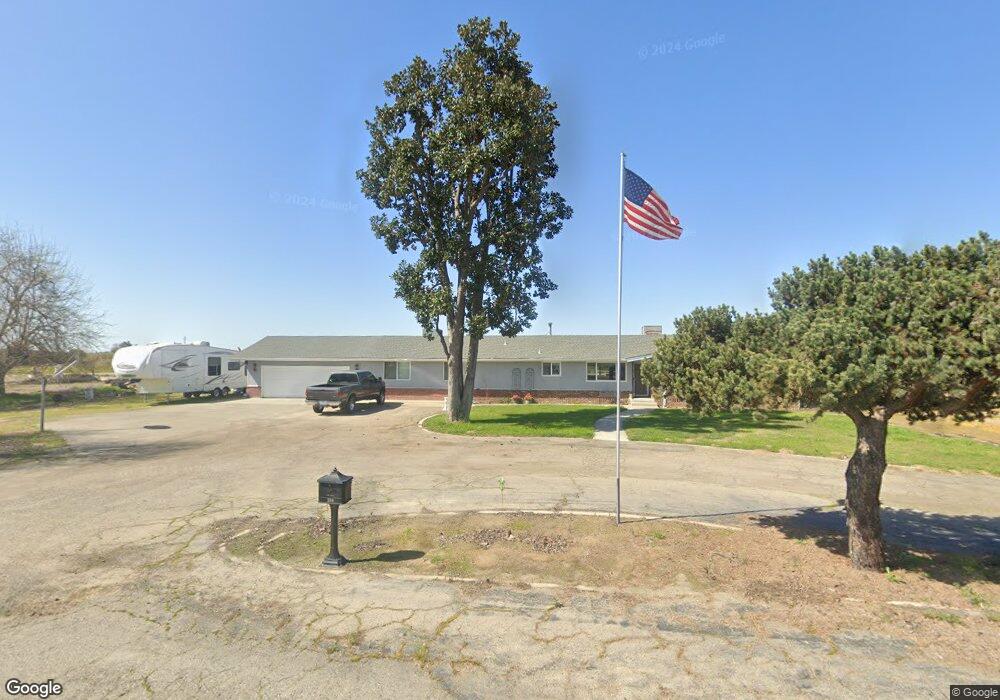
200 N 5th Ave Kingsburg, CA 93631
Estimated Value: $567,000 - $867,000
2
Beds
3
Baths
2,116
Sq Ft
$322/Sq Ft
Est. Value
About This Home
This home is located at 200 N 5th Ave, Kingsburg, CA 93631 and is currently estimated at $682,153, approximately $322 per square foot. 200 N 5th Ave is a home located in Kings County with nearby schools including Kingsburg High School, Roosevelt Elementary School, and Lincoln Elementary School.
Ownership History
Date
Name
Owned For
Owner Type
Purchase Details
Closed on
Sep 17, 2010
Sold by
Colbert Anthony P and Colbert Patricia L
Bought by
Colbert Anthony P and Colbert Patricia L
Current Estimated Value
Home Financials for this Owner
Home Financials are based on the most recent Mortgage that was taken out on this home.
Original Mortgage
$159,000
Interest Rate
4.26%
Mortgage Type
New Conventional
Purchase Details
Closed on
Jul 8, 2008
Sold by
Colbert Anthony P and Colbert Patricia L
Bought by
Colbert Anthony P and Colbert Patricia L
Purchase Details
Closed on
Feb 4, 1998
Sold by
Thiesen Albert H & Ethel M Revoc Lvg
Bought by
Colbert Anthony P and Colbert Patricia L
Home Financials for this Owner
Home Financials are based on the most recent Mortgage that was taken out on this home.
Original Mortgage
$110,400
Interest Rate
6.97%
Create a Home Valuation Report for This Property
The Home Valuation Report is an in-depth analysis detailing your home's value as well as a comparison with similar homes in the area
Home Values in the Area
Average Home Value in this Area
Purchase History
| Date | Buyer | Sale Price | Title Company |
|---|---|---|---|
| Colbert Anthony P | -- | Netco Title Company | |
| Colbert Anthony P | -- | Netco Title Company | |
| Colbert Anthony P | -- | None Available | |
| Colbert Anthony P | $138,000 | Chicago Title Co |
Source: Public Records
Mortgage History
| Date | Status | Borrower | Loan Amount |
|---|---|---|---|
| Closed | Colbert Anthony P | $159,000 | |
| Closed | Colbert Anthony P | $110,400 |
Source: Public Records
Tax History Compared to Growth
Tax History
| Year | Tax Paid | Tax Assessment Tax Assessment Total Assessment is a certain percentage of the fair market value that is determined by local assessors to be the total taxable value of land and additions on the property. | Land | Improvement |
|---|---|---|---|---|
| 2025 | $2,900 | $264,446 | $95,809 | $168,637 |
| 2023 | $2,900 | $254,180 | $92,090 | $162,090 |
| 2022 | $2,905 | $249,197 | $90,285 | $158,912 |
| 2021 | $2,839 | $244,312 | $88,515 | $155,797 |
| 2020 | $2,837 | $241,806 | $87,607 | $154,199 |
| 2019 | $2,759 | $237,064 | $85,889 | $151,175 |
| 2018 | $2,641 | $232,416 | $84,205 | $148,211 |
| 2017 | $2,609 | $227,859 | $82,554 | $145,305 |
| 2016 | $2,445 | $223,391 | $80,935 | $142,456 |
| 2015 | $2,442 | $79,719 | $79,719 | $0 |
| 2014 | $2,411 | $215,724 | $78,157 | $137,567 |
Source: Public Records
Map
Nearby Homes
- 343 S 6th Ave
- 5231 Chico Ave
- 5750 Benicia Ave
- 12647 E Clarkson Ave
- 343 6th Avenue Dr
- 1188 7 1 2 Ave
- 1170 Mehlert St
- 1217 Mehlert St
- 831 Rayser St
- 1061 11th Ave
- 641 Kern St
- 240 Kern St
- 1132 Draper St
- 901 Mariposa St
- 1925 Evergreen St
- 1303 22nd Ave
- 1551 6th Avenue Dr Unit 161
- 1551 6th Avenue Dr Unit 157
- 2454 Hudson St
- 1780 20th Ave
- 324 N 5th Ave
- 5135 Barstow Ave
- 5245 Barstow Ave
- 5086 Bangor Ave
- 479 S 5th Ave
- 131 N 5th Ave
- 5296 Bangor Ave
- 5344 Barstow Ave
- 237 N 5th Ave
- 259 N 5th Ave
- 673 S 5th Ave
- 672 S 5th Ave
- 5525 Barstow Ave
- 335 N 5th Ave
- 754 S 5th Ave
- 360 N 5th Ave
- 5637 Bangor Ave
- 5661 Bangor Ave
- 5640 Bangor Ave
- 5681 Bangor Ave