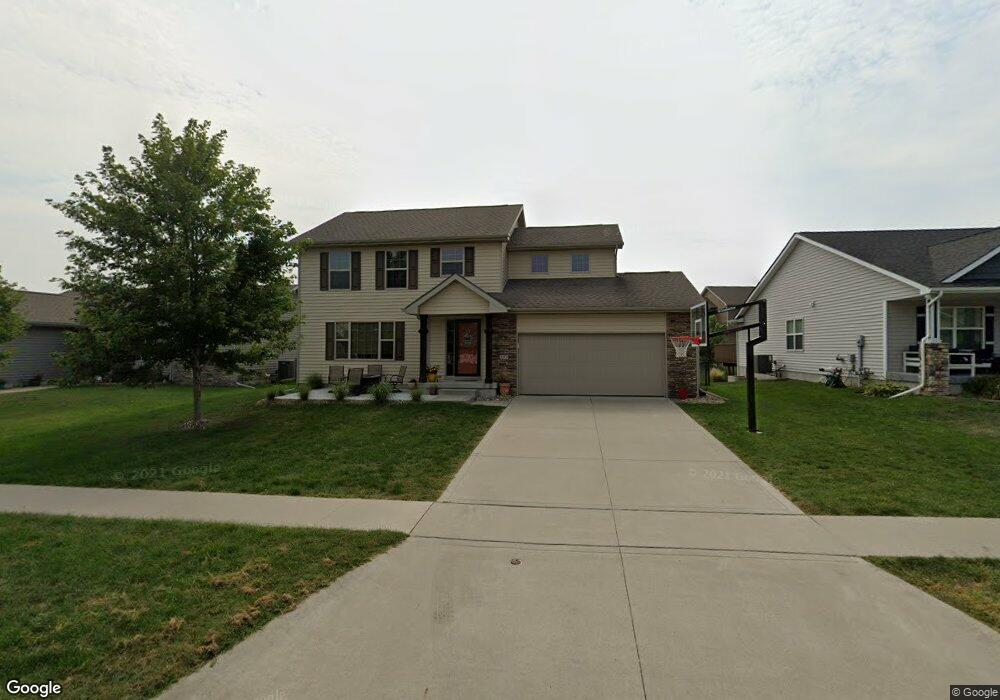
200 NE 25th Ct Grimes, IA 50111
Estimated Value: $367,341 - $406,000
4
Beds
3
Baths
1,759
Sq Ft
$221/Sq Ft
Est. Value
About This Home
This home is located at 200 NE 25th Ct, Grimes, IA 50111 and is currently estimated at $388,835, approximately $221 per square foot. 200 NE 25th Ct is a home located in Polk County with nearby schools including Heritage Elementary School, Dallas Center-Grimes Middle School, and Dallas Center - Grimes High School.
Ownership History
Date
Name
Owned For
Owner Type
Purchase Details
Closed on
Mar 8, 2017
Sold by
Nations Tyler W
Bought by
Nations Kristen N
Current Estimated Value
Purchase Details
Closed on
Mar 13, 2012
Sold by
Greystone Homes Lc
Bought by
Nations Tyler W and Nations Kristen N
Home Financials for this Owner
Home Financials are based on the most recent Mortgage that was taken out on this home.
Original Mortgage
$186,244
Outstanding Balance
$125,470
Interest Rate
3.47%
Mortgage Type
FHA
Estimated Equity
$263,365
Create a Home Valuation Report for This Property
The Home Valuation Report is an in-depth analysis detailing your home's value as well as a comparison with similar homes in the area
Home Values in the Area
Average Home Value in this Area
Purchase History
| Date | Buyer | Sale Price | Title Company |
|---|---|---|---|
| Nations Kristen N | -- | None Available | |
| Nations Tyler W | $194,500 | None Available |
Source: Public Records
Mortgage History
| Date | Status | Borrower | Loan Amount |
|---|---|---|---|
| Open | Nations Tyler W | $186,244 |
Source: Public Records
Tax History Compared to Growth
Tax History
| Year | Tax Paid | Tax Assessment Tax Assessment Total Assessment is a certain percentage of the fair market value that is determined by local assessors to be the total taxable value of land and additions on the property. | Land | Improvement |
|---|---|---|---|---|
| 2024 | $6,042 | $323,200 | $69,300 | $253,900 |
| 2023 | $5,814 | $323,200 | $69,300 | $253,900 |
| 2022 | $5,852 | $264,800 | $58,600 | $206,200 |
| 2021 | $5,574 | $264,800 | $58,600 | $206,200 |
| 2020 | $5,490 | $244,100 | $54,100 | $190,000 |
| 2019 | $5,206 | $244,100 | $54,100 | $190,000 |
| 2018 | $5,380 | $217,100 | $47,500 | $169,600 |
| 2017 | $5,138 | $217,100 | $47,500 | $169,600 |
| 2016 | $4,926 | $202,400 | $43,900 | $158,500 |
| 2015 | $4,926 | $202,400 | $43,900 | $158,500 |
| 2014 | $4,394 | $189,800 | $40,800 | $149,000 |
Source: Public Records
Map
Nearby Homes
- 2802 NE Brentwood Cir
- 2800 NE Cherry Ct
- 2215 NW Gabus Dr
- 809 NE Bridge Creek Ct
- 2100 NW Prairie Creek Dr
- 1000 NE 23rd St
- 1901 NW Prairie Creek Dr
- 2400 NE Birch Ln
- 2404 NE Birch Ln
- 701 NE Lakeview Dr
- 1716 NW Calista St
- 1704 NW Norton Ct
- 1716 NW Prairie Creek Dr
- 1424 NE Poplar Ct
- 1200 NE 22nd St
- 1420 Poplar St
- 1609 NW Prairie Creek Dr
- 2860 NW Brookside Dr
- 1413 NE Park St
- 508 NE 13th St
- 108 NE 25th Ct
- 104 NE 25th Ct
- 208 NE 25th Ct
- 205 NE 25th Ct
- 205 NE 24th Ct
- 201 NE 25th Ct
- 109 NE 25th Ct
- 209 NE 25th Ct
- 100 NE 25th Ct
- 105 NE 25th Ct
- 101 NE 24th Ct
- 213 NE 25th Ct
- 101 NE 25th Ct
- 100 NE 24th Ct
- 217 NE 25th Ct
- 108 NE Tanzanite Ct
- 104 NE Tanzanite Ct
- 2505 NE Ewing Ct
- 200 NE Tanzanite Ct
- 2417 NE Ewing Ct