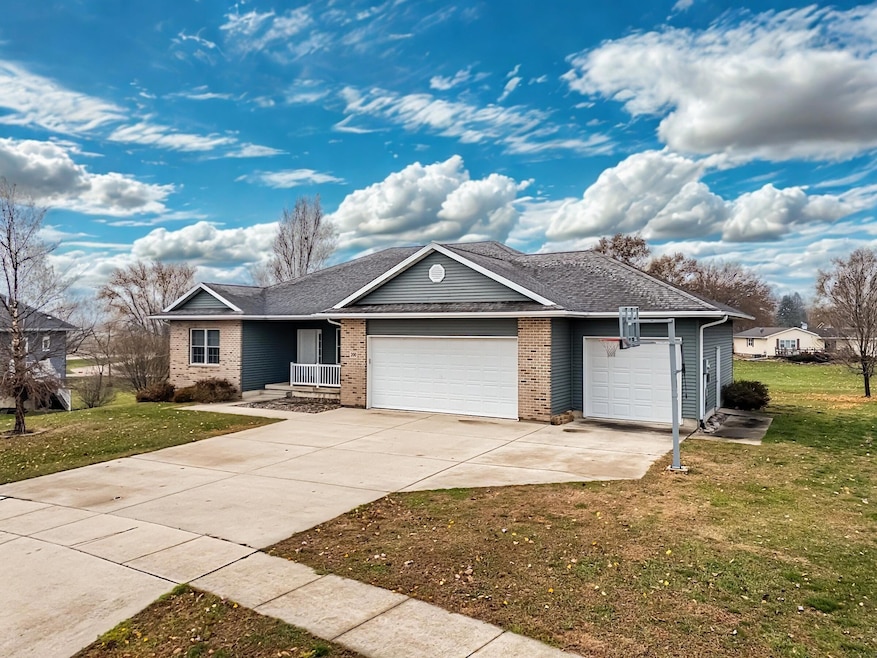
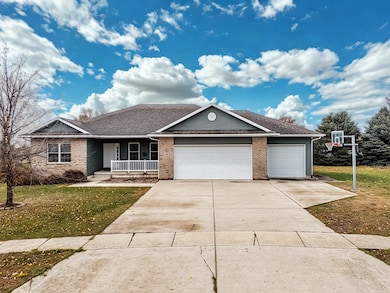
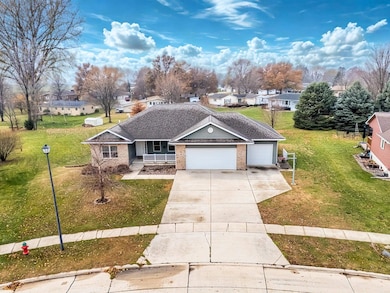
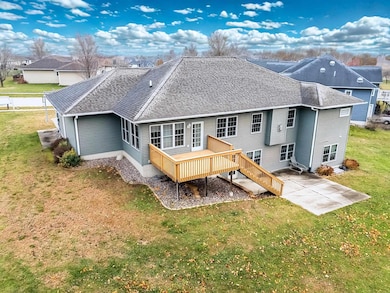
200 Pheasant Ln Hudson, IA 50643
Estimated payment $2,949/month
Highlights
- 0.6 Acre Lot
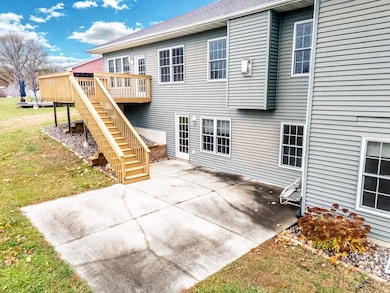
- Deck
- 3 Car Attached Garage
- Hudson Elementary School Rated 9+
- Enclosed Patio or Porch
- Central Air
About This Home
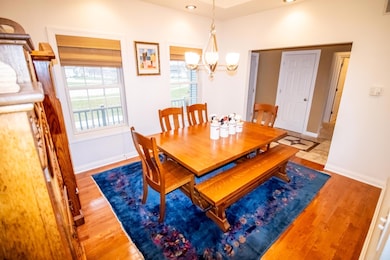
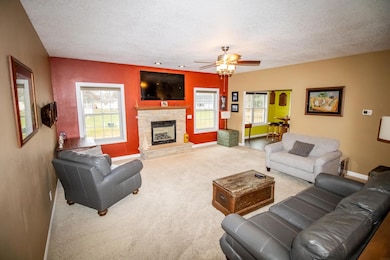
Spacious and inviting ranch-style home designed for comfortable living and entertaining. This home boasts four generously-sized bedrooms—two conveniently located on the main level and two more on the lower level—along with three full bathrooms, providing ample space for family and guests. A true highlight is the light-filled four-season sunroom, featuring large windows that bring in abundant natural light and offer a serene space to enjoy year-round. Main level features a dedicated formal dining room, perfect for hosting holiday gatherings and special occasions. Beyond its aesthetic appeal, this property offers incredible efficiency and low operating costs thanks to the state-of-the-art geo-thermal heating and cooling system, providing superior, eco-friendly comfort. The lower level includes a partially finished walk-out basement, and the attached three-stall garage completes this fantastic package.
Home Details
Home Type
- Single Family
Est. Annual Taxes
- $6,758
Year Built
- Built in 2008
Lot Details
- 0.6 Acre Lot
Parking
- 3 Car Attached Garage
Home Design
- Shingle Roof
- Asphalt Roof
- Vinyl Siding
Interior Spaces
- 2,913 Sq Ft Home
- Living Room with Fireplace
- Partially Finished Basement
- Walk-Out Basement
Bedrooms and Bathrooms
- 4 Bedrooms
- 3 Full Bathrooms
Outdoor Features
- Deck
- Enclosed Patio or Porch
Schools
- Hudson Elementary And Middle School
- Hudson High School
Utilities
- Central Air
- Geothermal Heating and Cooling
Listing and Financial Details
- Assessor Parcel Number 881426451027
Map
Home Values in the Area
Average Home Value in this Area
Tax History
| Year | Tax Paid | Tax Assessment Tax Assessment Total Assessment is a certain percentage of the fair market value that is determined by local assessors to be the total taxable value of land and additions on the property. | Land | Improvement |
|---|---|---|---|---|
| 2025 | $6,588 | $404,280 | $67,420 | $336,860 |
| 2024 | $6,588 | $404,280 | $67,420 | $336,860 |
| 2023 | $5,656 | $404,280 | $67,420 | $336,860 |
| 2022 | $5,202 | $310,760 | $67,420 | $243,340 |
| 2021 | $5,344 | $310,760 | $67,420 | $243,340 |
| 2020 | $5,330 | $299,900 | $49,030 | $250,870 |
| 2019 | $5,330 | $299,900 | $49,030 | $250,870 |
| 2018 | $5,508 | $299,900 | $49,030 | $250,870 |
| 2017 | $5,614 | $299,900 | $49,030 | $250,870 |
| 2016 | $5,394 | $299,900 | $49,030 | $250,870 |
| 2015 | $5,394 | $299,900 | $49,030 | $250,870 |
| 2014 | $5,604 | $304,270 | $49,030 | $255,240 |
Property History
| Date | Event | Price | List to Sale | Price per Sq Ft |
|---|---|---|---|---|
| 11/18/2025 11/18/25 | For Sale | $455,000 | -- | $156 / Sq Ft |
Purchase History
| Date | Type | Sale Price | Title Company |
|---|---|---|---|
| Joint Tenancy Deed | $292,000 | None Available | |
| Warranty Deed | $44,000 | None Available |
Mortgage History
| Date | Status | Loan Amount | Loan Type |
|---|---|---|---|
| Closed | $188,000 | New Conventional |
Source: Northeast Iowa Regional Board of REALTORS®
MLS Number: NBR20255646
APN: 8814-26-451-027
Disclaimer: Certain information contained herein is derived from information provided by parties other than Homes.com. All information provided is deemed reliable, but is not guaranteed to be accurate and should be independently verified.
![]() IDX information is provided exclusively for personal, non-commercial use, and may not be used for any purpose other than to identify prospective properties consumers may be interested in purchasing. Information is deemed reliable but not guaranteed.
IDX information is provided exclusively for personal, non-commercial use, and may not be used for any purpose other than to identify prospective properties consumers may be interested in purchasing. Information is deemed reliable but not guaranteed.
- 205 Pirate St
- 115 Washington St
- 451 1st St
- 226 Sunset
- 417 Primrose Dr
- 418 Primrose Dr
- 434 Primrose Dr
- 175 Hall St
- Lot #32 Live Oak Dr
- Lot #26 Live Oak Dr
- Lot #20 Live Oak Dr
- Lot #28 Live Oak Dr
- Lot #23 Live Oak Dr
- Lot #29 Live Oak Dr
- Lot #13 Live Oak Dr
- Lot #22 Live Oak Dr
- Lot #14 Live Oak Dr
- Lot #16 Live Oak Dr
- Lot #11 Live Oak Dr
- Lot #2 Live Oak Dr
- 301-313 Springfield Ave
- 402 Fast Ln
- 1867 Pinehurst Ct
- 3855 Pineview Place
- 3844 W 4th St Unit 10
- 765-791 Russell Rd
- 733-747 Russell Rd
- 1105-1110 Kent Cir
- 150 Rapids Square
- 825 Bluegrass
- 1003 Bluegrass Cir
- 3322 Tropic Ln
- 4426-4606 Ashworth Dr
- 4526 Chadwick Rd
- 715 Spruce Needle Ln
- 4705 Chadwick Rd Unit 3
- 3666 Ravenwood Cir
- 3714 Ravenwood Cir
- 4328 Spruce Creek Dr
- 1229 Ravenwood Rd Unit 3
