Estimated Value: $521,000 - $555,759
3
Beds
3
Baths
1,600
Sq Ft
$340/Sq Ft
Est. Value
About This Home
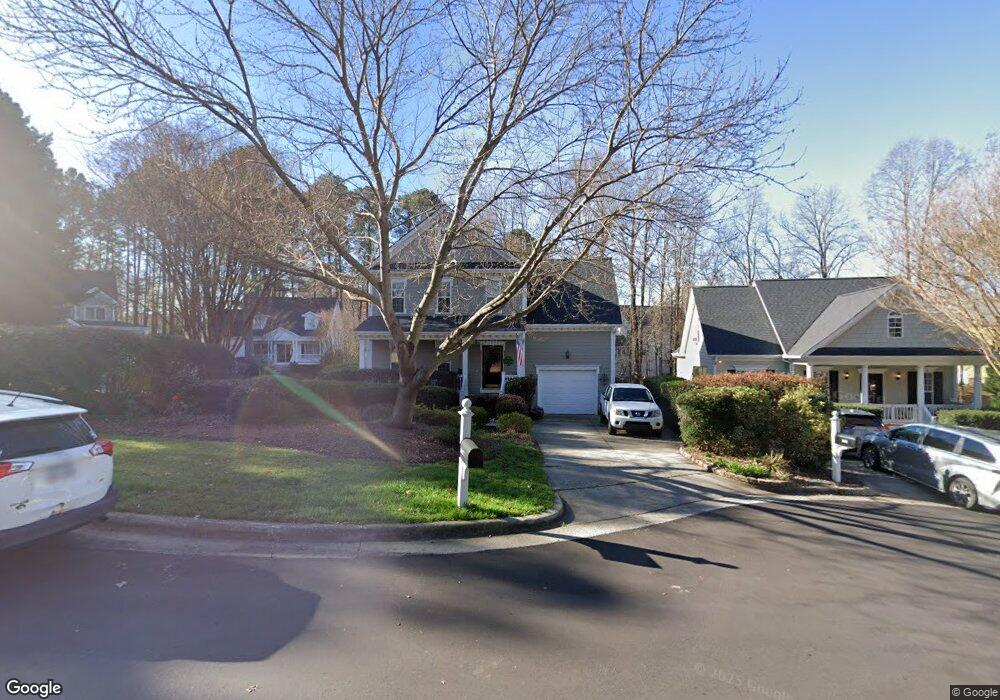
This home is located at 200 Pine Mill Ln, Apex, NC 27502 and is currently estimated at $543,440, approximately $339 per square foot. 200 Pine Mill Ln is a home located in Wake County with nearby schools including Scotts Ridge Elementary School, Apex Middle, and Apex High School.
Ownership History
Date
Name
Owned For
Owner Type
Purchase Details
Closed on
Aug 29, 2003
Sold by
Whitmarsh Mark R and Whitmarsh Jennifer S
Bought by
Muhs Timothy E and Muhs Michelle A
Current Estimated Value
Home Financials for this Owner
Home Financials are based on the most recent Mortgage that was taken out on this home.
Original Mortgage
$190,434
Outstanding Balance
$85,171
Interest Rate
5.72%
Mortgage Type
VA
Estimated Equity
$458,269
Purchase Details
Closed on
Sep 19, 2001
Sold by
Blankenship & Mussler Construction Inc
Bought by
Whitmarsh Mark R and Whitmarsh Jennifer S
Home Financials for this Owner
Home Financials are based on the most recent Mortgage that was taken out on this home.
Original Mortgage
$173,773
Interest Rate
6.97%
Mortgage Type
FHA
Purchase Details
Closed on
Apr 11, 1999
Sold by
Stratford Woods Llc
Bought by
Blankenship & Mussler Construction Inc
Create a Home Valuation Report for This Property
The Home Valuation Report is an in-depth analysis detailing your home's value as well as a comparison with similar homes in the area
Purchase History
| Date | Buyer | Sale Price | Title Company |
|---|---|---|---|
| Muhs Timothy E | $187,000 | -- | |
| Whitmarsh Mark R | $176,500 | -- | |
| Blankenship & Mussler Construction Inc | $61,000 | -- |
Source: Public Records
Mortgage History
| Date | Status | Borrower | Loan Amount |
|---|---|---|---|
| Open | Muhs Timothy E | $190,434 | |
| Previous Owner | Whitmarsh Mark R | $173,773 |
Source: Public Records
Tax History
| Year | Tax Paid | Tax Assessment Tax Assessment Total Assessment is a certain percentage of the fair market value that is determined by local assessors to be the total taxable value of land and additions on the property. | Land | Improvement |
|---|---|---|---|---|
| 2025 | $2,892 | $557,980 | $180,000 | $377,980 |
| 2024 | $4,782 | $557,980 | $180,000 | $377,980 |
Source: Public Records
Map
Nearby Homes
- 1216 Scotts Ridge Trail
- 106 Forestcrest Ct
- 1050 Scotts Ridge Trail
- 1913 Metta Mill Ln
- 2002 Kelly Glen Dr
- 440 Oak Pine Dr
- 1880 Woodall Crest Dr
- 400 Village Loop Dr
- 402 Village Loop Dr
- 1866 Porch Swing Way
- 2129 Kelly Rd
- 1811 Aspen River Ln
- 1936 Rabbit Hop Trail
- 1702 Melbry Ct
- 1809 Barrett Run Trail
- 1701 Grand Barton Ct
- 1839 Aspen River Ln
- 1303 Goldspot Ct
- 2022 Van Hook Ln
- 1706 Burgundy Park Dr
- 202 Pine Mill Ln
- 101 Pine Nut Ln
- 204 Pine Mill Ln
- 112 Pine Mill Ln
- 100 Pine Nut Ln
- 201 Pine Mill Ln
- 106 Berrygarden Ct
- 104 Berrygarden Ct
- 102 Pine Nut Ln
- 203 Pine Mill Ln
- 205 Pine Mill Ln
- 206 Pine Mill Ln
- 111 Pine Mill Ln
- 110 Pine Mill Ln
- 213 Pine Nut Ln
- 105 Berrygarden Ct
- 100 Berrygarden Ct
- 105 Derrygarden Ct
- 109 Pine Mill Ln
- 92 Rushing Wind Way
Your Personal Tour Guide
Ask me questions while you tour the home.