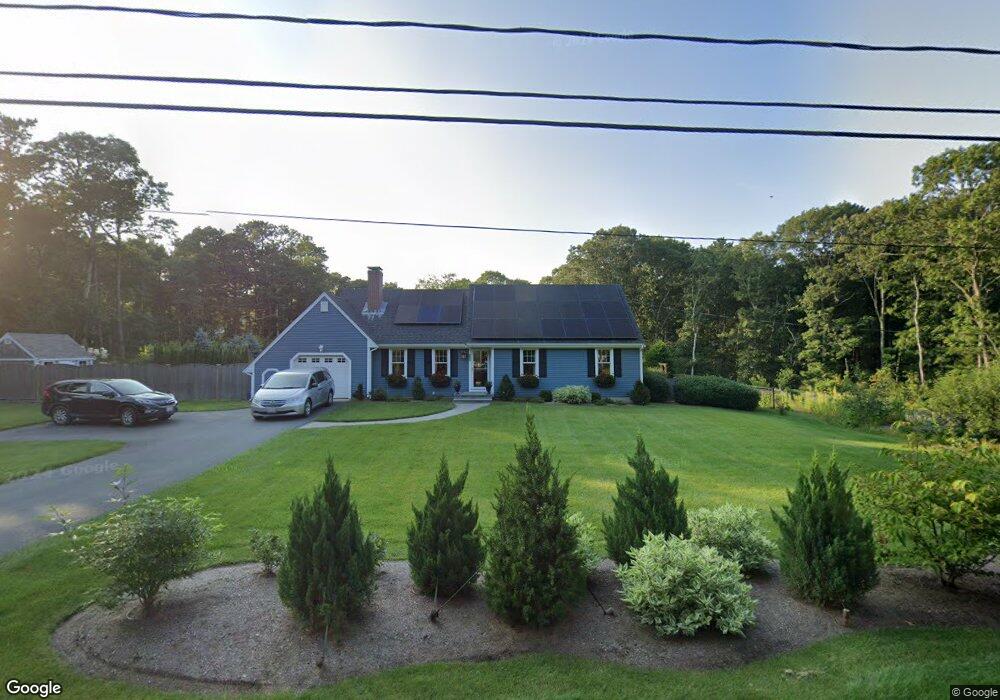
200 Round Cove Rd Harwich, MA 02645
East Harwich NeighborhoodEstimated Value: $594,000 - $722,219
3
Beds
2
Baths
1,192
Sq Ft
$573/Sq Ft
Est. Value
About This Home
This home is located at 200 Round Cove Rd, Harwich, MA 02645 and is currently estimated at $682,555, approximately $572 per square foot. 200 Round Cove Rd is a home located in Barnstable County with nearby schools including Harwich Elementary School, Chatham Elementary School, and Monomoy Regional Middle School.
Ownership History
Date
Name
Owned For
Owner Type
Purchase Details
Closed on
Mar 16, 2018
Sold by
Plumb Leslie A and Plumb Kevin G
Bought by
Plumb Rt
Current Estimated Value
Purchase Details
Closed on
Apr 29, 2016
Sold by
Mckay Ellen L
Bought by
Plumb Kevin G and Plumb Leslie A
Home Financials for this Owner
Home Financials are based on the most recent Mortgage that was taken out on this home.
Original Mortgage
$337,000
Interest Rate
3%
Mortgage Type
New Conventional
Purchase Details
Closed on
May 5, 2008
Sold by
Gloria B Lindberg Ft and Lindberg Edward T
Bought by
Mckay Ellen L
Home Financials for this Owner
Home Financials are based on the most recent Mortgage that was taken out on this home.
Original Mortgage
$250,000
Interest Rate
5.99%
Mortgage Type
Purchase Money Mortgage
Create a Home Valuation Report for This Property
The Home Valuation Report is an in-depth analysis detailing your home's value as well as a comparison with similar homes in the area
Home Values in the Area
Average Home Value in this Area
Purchase History
| Date | Buyer | Sale Price | Title Company |
|---|---|---|---|
| Plumb Rt | -- | -- | |
| Plumb Kevin G | $375,000 | -- | |
| Mckay Ellen L | $335,000 | -- |
Source: Public Records
Mortgage History
| Date | Status | Borrower | Loan Amount |
|---|---|---|---|
| Previous Owner | Plumb Kevin G | $337,000 | |
| Previous Owner | Mckay Ellen L | $250,000 |
Source: Public Records
Tax History Compared to Growth
Tax History
| Year | Tax Paid | Tax Assessment Tax Assessment Total Assessment is a certain percentage of the fair market value that is determined by local assessors to be the total taxable value of land and additions on the property. | Land | Improvement |
|---|---|---|---|---|
| 2025 | $4,142 | $700,800 | $266,800 | $434,000 |
| 2024 | $3,836 | $636,100 | $226,500 | $409,600 |
| 2023 | $3,678 | $553,900 | $205,900 | $348,000 |
| 2022 | $3,628 | $447,400 | $179,100 | $268,300 |
| 2021 | $3,388 | $394,000 | $162,800 | $231,200 |
| 2020 | $3,352 | $384,000 | $161,000 | $223,000 |
| 2019 | $3,137 | $361,800 | $154,800 | $207,000 |
| 2018 | $3,161 | $348,700 | $140,700 | $208,000 |
| 2017 | $2,898 | $323,100 | $128,300 | $194,800 |
| 2016 | $2,729 | $300,900 | $128,300 | $172,600 |
| 2015 | $2,632 | $293,400 | $125,800 | $167,600 |
| 2014 | $2,499 | $284,900 | $122,100 | $162,800 |
Source: Public Records
Map
Nearby Homes
- 16 Partridge Ln
- 6 Levi's Ln
- 152 Pleasant Bay Rd
- Lot 2 Round Cove Rd
- 3 Seagull Ln
- 33 Pine Orchard Rd
- 47 Whidah Dr
- 76 Williamsburg Ave
- 104 Wayside Dr
- 6 Cora Nickerson Rd
- 0 S Orleans Rd
- 44 Old Heritage Way
- 850 Queen Anne Rd
- 38 Rainbow Way
- 58 Sugar Hill Dr
- 7 Sandy Ln
- 24 Chickadee Ln
- 299 Depot Rd
- 26 Walkerwoods Dr
- 24 Chickadee Cir