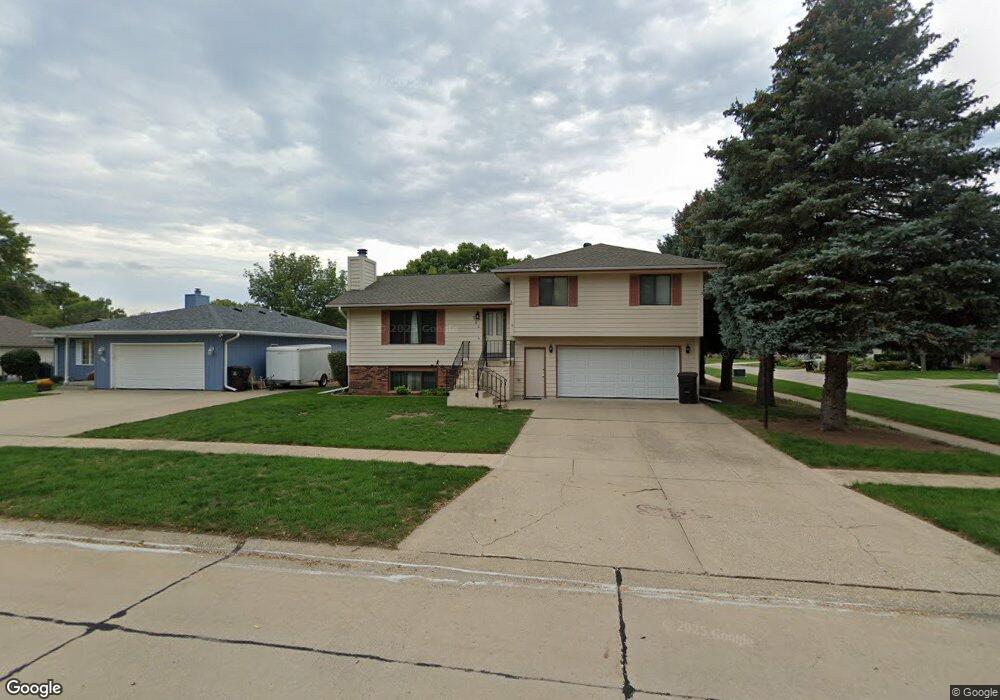
200 Ruby Ct Sergeant Bluff, IA 51054
Estimated Value: $277,051 - $374,000
4
Beds
4
Baths
1,200
Sq Ft
$265/Sq Ft
Est. Value
About This Home
This home is located at 200 Ruby Ct, Sergeant Bluff, IA 51054 and is currently estimated at $317,763, approximately $264 per square foot. 200 Ruby Ct is a home located in Woodbury County with nearby schools including Sergeant Bluff-Luton Primary School, Sergeant Bluff-Luton Elementary School, and Sergeant Bluff-Luton Middle School.
Ownership History
Date
Name
Owned For
Owner Type
Purchase Details
Closed on
Jun 29, 2006
Sold by
Nichol John D and Nichol Karen R
Bought by
Orsini Keith A
Current Estimated Value
Home Financials for this Owner
Home Financials are based on the most recent Mortgage that was taken out on this home.
Original Mortgage
$127,800
Outstanding Balance
$75,765
Interest Rate
6.72%
Mortgage Type
New Conventional
Estimated Equity
$241,998
Create a Home Valuation Report for This Property
The Home Valuation Report is an in-depth analysis detailing your home's value as well as a comparison with similar homes in the area
Home Values in the Area
Average Home Value in this Area
Purchase History
| Date | Buyer | Sale Price | Title Company |
|---|---|---|---|
| Orsini Keith A | $408,820 | -- |
Source: Public Records
Mortgage History
| Date | Status | Borrower | Loan Amount |
|---|---|---|---|
| Open | Orsini Keith A | $127,800 |
Source: Public Records
Tax History
| Year | Tax Paid | Tax Assessment Tax Assessment Total Assessment is a certain percentage of the fair market value that is determined by local assessors to be the total taxable value of land and additions on the property. | Land | Improvement |
|---|---|---|---|---|
| 2025 | $3,228 | $241,960 | $18,360 | $223,600 |
| 2024 | $31 | $228,000 | $19,860 | $208,140 |
| 2023 | $3,008 | $228,000 | $19,860 | $208,140 |
| 2022 | $2,980 | $183,480 | $19,860 | $163,620 |
| 2021 | $2,980 | $183,480 | $19,860 | $163,620 |
| 2020 | $2,668 | $162,390 | $21,250 | $141,140 |
| 2019 | $2,712 | $162,390 | $21,250 | $141,140 |
| 2018 | $2,642 | $162,390 | $21,250 | $141,140 |
| 2017 | $2,870 | $162,390 | $21,250 | $141,140 |
| 2016 | $2,920 | $162,390 | $0 | $0 |
| 2015 | $2,702 | $151,770 | $19,860 | $131,910 |
| 2014 | $2,548 | $138,580 | $19,860 | $118,720 |
Source: Public Records
Map
Nearby Homes